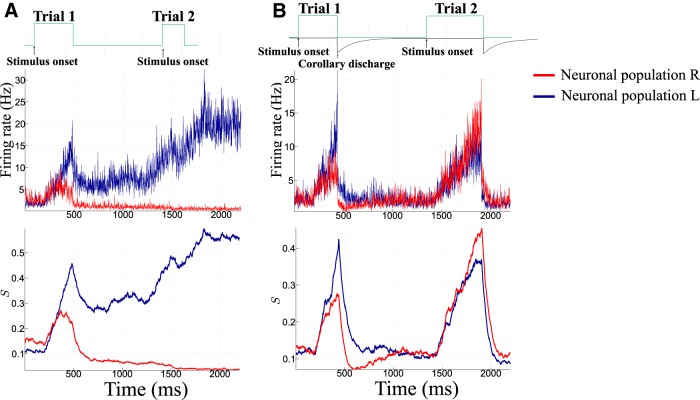
Figure 3.
Time course of activities during two consecutive trials. A, Without CD. Top (green plot), Time course of the stimulations. The first stimulus belongs to category L, the second to category R. Middle, firing rates of the L (blue) and R (red) neural pools. Bottom, corresponding synaptic activities. The neural activity becomes stuck in the attractor corresponding to the first decision. B, With CD, with ICD,max = 0.035 nA. Top, Time course of the stimulations (green plot; same protocol as for A), and time course of the inhibitory current (black curve, represented inverted for clarity of the presentation). B, Middle and Bottom, Neural and synaptic activities, respectively (L pool, blue; R pool, red). In that case, one observes the decay of activity after a decision has been made, and the winning population is different for the two trials.

