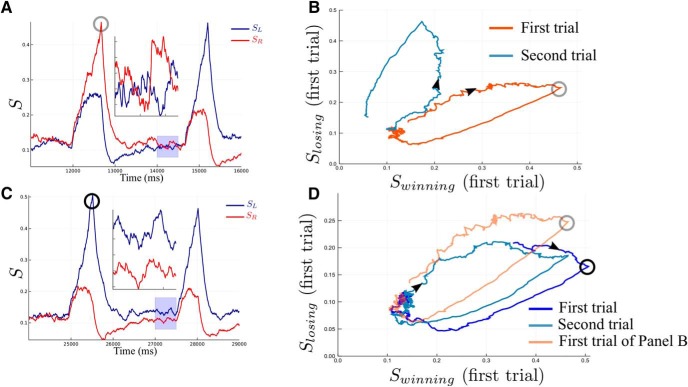
Figure 6.
Network activity during two consecutive trials. A, B, The alternated case where the decision made is R then L. C, D, The case where decision L is made and repeated. A, C, The time course activities of the network. The light blue zone is zoomed to better see the dynamics just before the onset of the second stimulus. The red and blue curves correspond to the activities of, respectively, the R and L network units. B, D, Represent, respectively, the A and C dynamics in the phase-plane coordinates. B, The dynamics evolve from dark red (first trial) to light blue (second trial), and (D) from dark blue (first trial) toward light blue (second trial). The gray, respectively black, circles identify the same specific point during the dynamics in A and B, respectively, C and D. The circles are not at the exact same value because the decision threshold is on the firing rates and not for the synaptic activities. To compare the alternated and repeated cases A and B and C and D, the dark red curve of B, is reproduced on D as a light orange curve.

