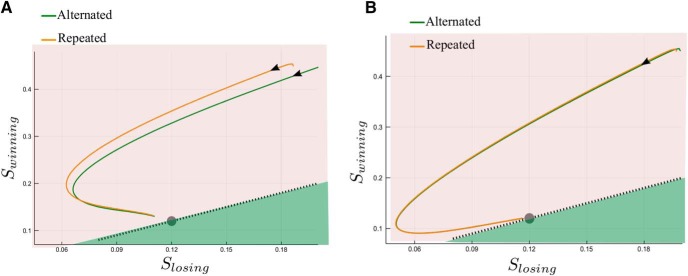
Figure 7.
Phase plane dynamics. Dynamics of the decaying activity between two successive trials (A) for ICD,max = 0.035 nA, and (B) for ICD,max = 0.08 nA. The synaptic activity is averaged over all trials separately for each one of the two groups: alternated (green) and repeated (orange). The axis are Swinning and Slosing (not SR and SL) corresponding to the mean synaptic activity of, respectively, the winning and the losing populations for this trial. Note the difference in scale of the two axes. The time evolution along each curve follows the black arrow. The dashed black line denotes the symmetric states (SL = SR) of the network, and the gray circle the neutral attractor. The shadow areas represent the basins of attraction (at low coherence levels) for the repeated and alternated trials, respectively, pink and green.

