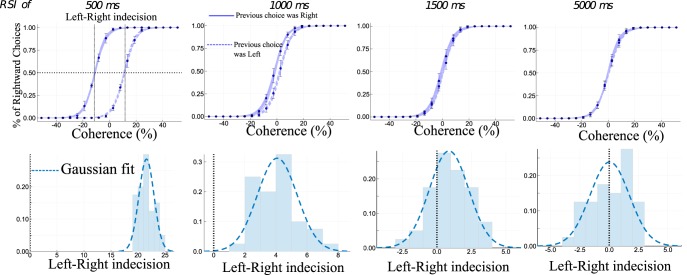
Figure 8.
Repetition biases for several RSI values. Top, Percentage of Right choices, with respect to coherence level, depending on the previous choice (Left or Right). The blue points represents the mean accuracy (on 24 simulations) and the confidence interval at 95% (bootstrap method). The blue lines denote the fit (of all simulations) by a logistic regression of all (plain, previous choice was Right; dashed, previous choice was Left). Bottom, Histogram of the Left–Right indecision point (on 24 simulations to stay in the experimental range). It characterizes the fact that the positive shift in the indecision point is increased for small RSI. The mean of the indecision point shift decreases with longer RSIs.

