Figure 2.
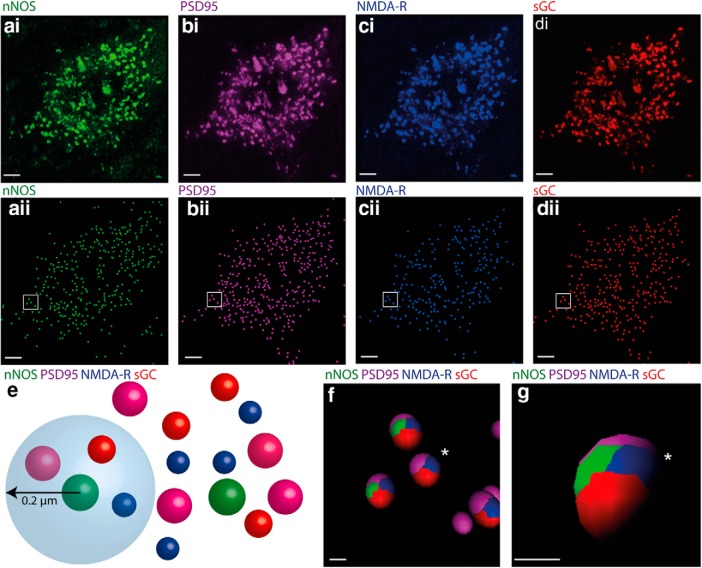
nNOS puncta in the IC are in close proximity to puncta labeled for PSD95, NMDA-R, and sGC. ai, Cell soma in the ICc showing nNOS puncta (green). The same cell also contains PSD-95 (bi, magenta), NMDA-R (ci, blue), and sGC (di, red). In aii, bii, cii, and dii, labeled puncta in the raw images ai–di have been rendered to spots in Imaris. e, Illustration showing how we determined whether individual nNOS puncta were in close proximity to puncta labeled for PSD95, NMDA-R, and sGC. A sphere of 0.2 μm radius was centered on each nNOS spot and the occurrence of PSD95, NMDA-R, and sGC spots within this sphere was determined. f, Ellipsoids (shown for the box in aii–dii) are colored to show the occurrence of the four proteins within the 0.2 μm sphere of interest. Virtually all nNOS spots are in close proximity to spots representing PSD-95, NMDA, and sGC. Note that even where only three colors are seen in this 2D view (cluster marked by *), when the vantage point is changed (g), the fourth color can be seen. Scale bars: a–d, 10 μm; f, g, 1 μm.

