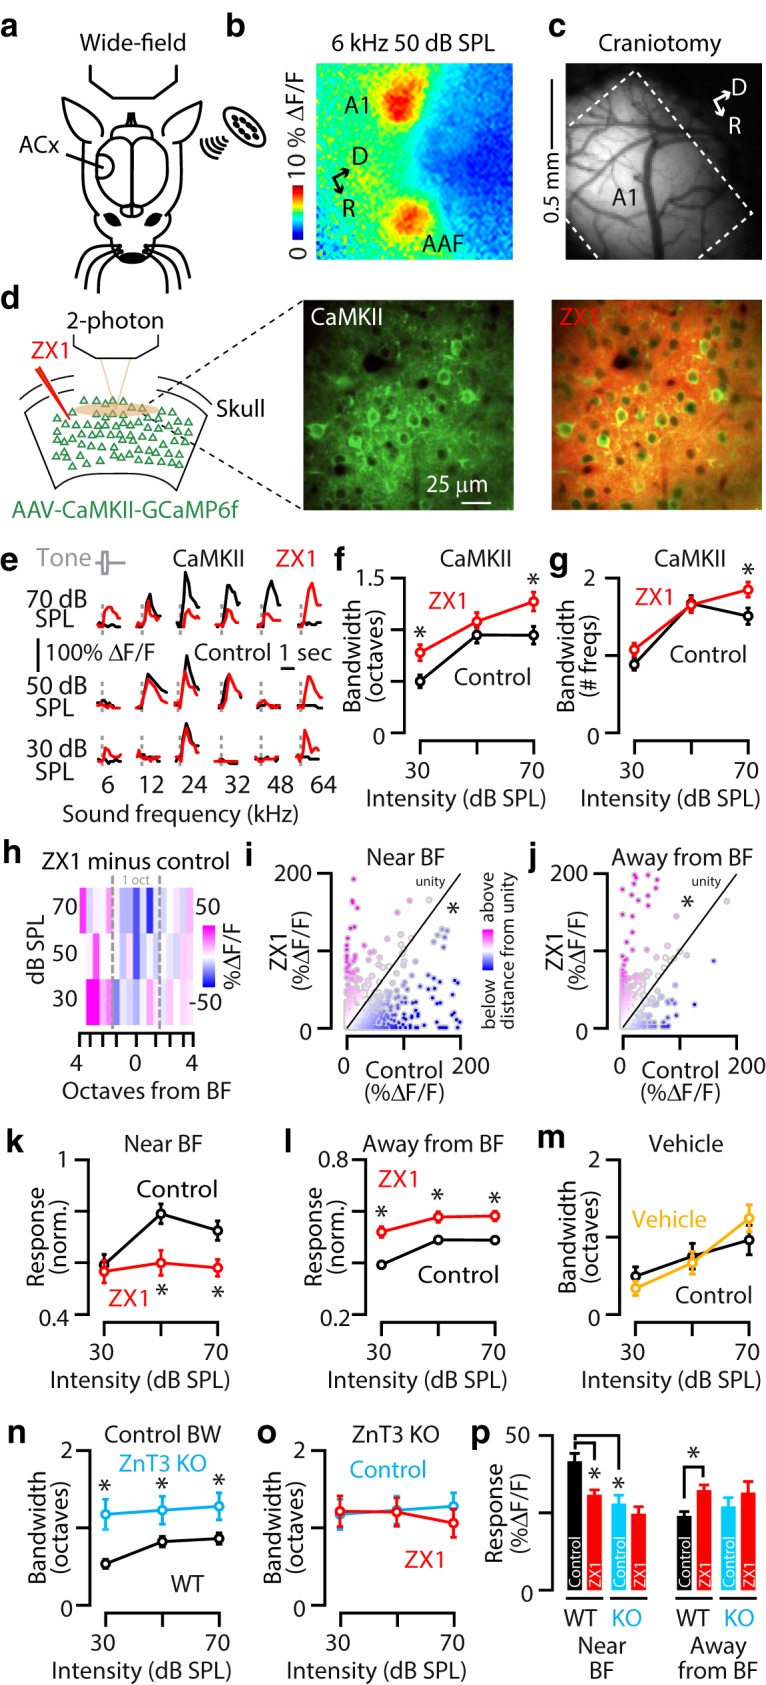
Figure 1.

Synaptic zinc sharpens the frequency tuning of A1 L2/3 principal neurons. a, Schematic of an experimental setup illustrating transcranial imaging using GCaMP6f in a head-fixed awake mouse. Sounds are delivered through a calibrated speaker. ACx, auditory cortex. b, A 6 kHz, 50 dB SPL tone triggered GCaMP6f fluorescence responses in two discrete regions of the auditory cortex representing primary auditory cortex (A1) and the AAF. D, Dorsal; R, rostral. c, Image illustrating a craniotomy over primary auditory cortex (A1). D, Dorsal; R, rostral. d, Left, Schematic of an experimental setup illustrating two-photon imaging of GCaMP6f in principal neurons. Middle, Image of a population of A1 L2/3 principal neurons. Right, The same neurons as in the middle after ZX1 infusion. e, Representative example of the receptive fields of an A1 L2/3 principal neuron in control (black) and after ZX1 (red). f, Average effect of ZX1 (red) on the receptive field bandwidth of L2/3 principal neurons at different sound intensities [control (black) vs ZX1: 30 dB SPL, p = 0.007; 70 dB SPL, p = 0.003; n = 232 neurons from 9 mice, signed-rank tests]. g, Average effect of ZX1 (red) on the number of sound frequencies a neuron responds to [control (black) vs ZX1: 70 dB SPL, p = 0.001; signed-rank test]. h, Heat map showing the average change in response amplitudes after ZX1 infusion (amplitude in ZX1 minus amplitude in control) to tone frequencies below, near, and above BF: pink indicates larger response amplitudes after ZX1, and blue indicates smaller response amplitudes after ZX1. i, Scatter plots of sound-evoked responses in control versus ZX1 for all sound intensities and frequencies near BF (compared with unity, p = 4.4e−5, one-sample t test). j, Same as i but to tone frequencies away from BF compared with unity (p = 0.026, one-sample t test). We observed that 16.3% of neurons developed a response to a sound frequency that had not evoked a response in control, whereas 12.9% of neurons lost a response to a sound frequency that had evoked a response in control. k, Average effect of ZX1 (red) on the sound-evoked response amplitudes of principal neurons to tones with frequencies within 1 octave from the BF [control (black) vs ZX1: 50 dB SPL, p = 0.001; 70 dB SPL, p = 0.0001]. l, Average effect of ZX1 (red) on the sound-evoked response amplitudes of principal neurons to tones with frequencies >1 octave away from BF [control (black) vs ZX1: 30 dB SPL, p = 0.0004; 50 dB SPL, p = 0.002; 70 dB SPL, p = 4.5e-5]. m, Same as in f but in but after vehicle infusion. n, Average receptive field bandwidths (BW) in control for WT and ZnT3 KO [WT (black) vs ZnT3 KO (blue): 30 dB SPL, p = 0.0023; 50 dB SPL, p = 0.0392; 70 dB SPL, p = 0.0188; n = 290 neurons from 13 mice in WT, n = 56 neurons from 3 mice in ZnT3 KO, rank sum tests.) o, Same as in f but in ZnT3 KO. p, Average sound-evoked response amplitudes to sounds with frequencies near BF (left) and away from BF (right) for WT and ZnT3 KO mice. Near BF: WT control (black) versus WT ZX1 (red), p = 0.0003; WT control vs ZnT3 control (blue), p = 0.0025. Away from BF: WT control vs WT ZX1, p = 0.0001. For all panels, asterisks indicate significant differences after accounting for multiple comparisons using the Holm–Bonferroni's correction; error bars indicate SEM. Detailed values and statistical tests are listed in the Materials and Methods.
