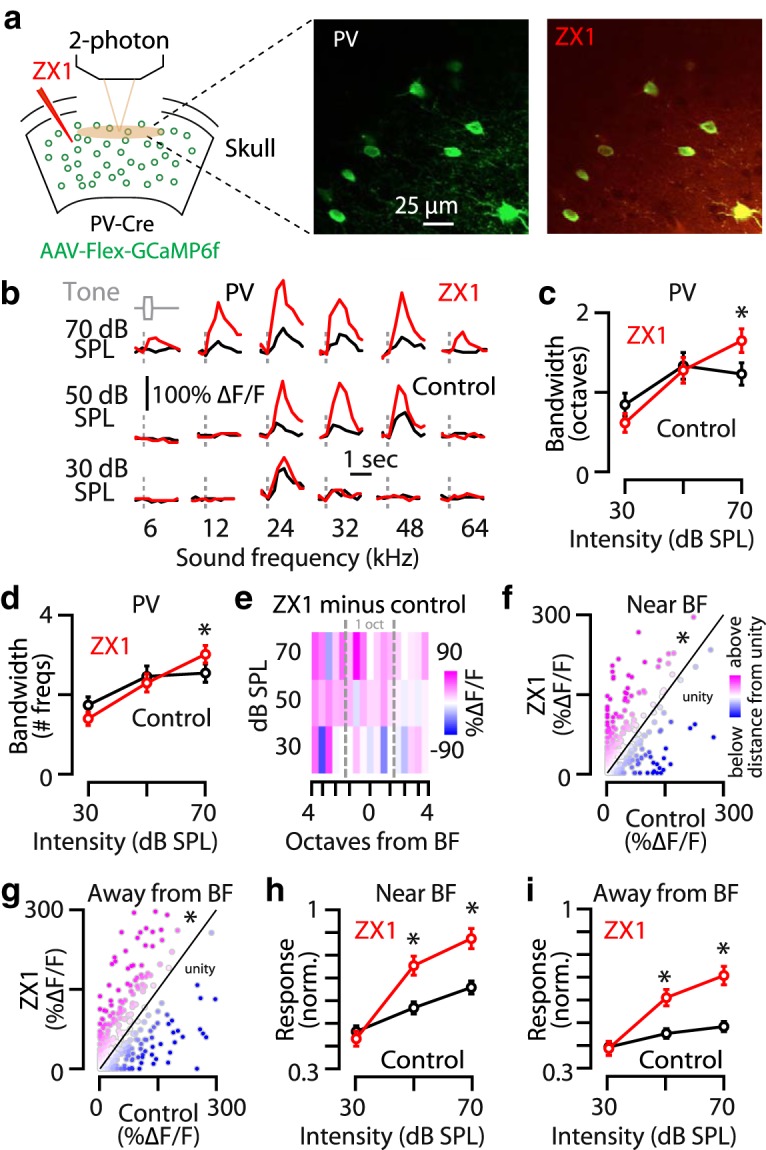
Figure 2.

Synaptic zinc sharpens the frequency tuning of A1 L2/3 PV neurons. a, Left, Schematic of the experimental setup illustrating two-photon imaging of GCaMP6f in PV neurons. Middle, Image of a population of A1 L2/3 PV neurons. Right, The same neurons as in the middle after ZX1 infusion. b, Representative example of the receptive fields of an A1 L2/3 PV neuron in control (black) and after ZX1 infusion (red). c, Average effect of ZX1 (red) on the receptive field bandwidth of L2/3 PV neurons at different sound intensities [ZX1 vs control (black); 70 dB: p = 0.0092, signed-rank test, n = 67 neurons from 8 mice]. d, Average effect of ZX1 (red) on the number of sound frequencies a neuron responds to [control (black) vs ZX1; 70 dB SPL, p = 0.004]. e, Heat map showing the average change in response amplitudes after ZX1 infusion (amplitude in ZX1 minus amplitude in control) to tone frequencies below, near, and above BF: pink indicates larger response amplitudes after ZX1, and blue indicates smaller response amplitudes after ZX1. f, Scatter plots of sound-evoked responses at all intensities to tone frequencies near BF for control versus ZX1; compared with unity, p = 0.02, one-sample t test. g, Same as f but to sound frequencies away from BF; compared with unity, p = 0.008, one-sample t test. We observed that 16.4% of neurons developed a response to a sound frequency that had not evoked a response in control, whereas 10.9% of neurons lost a response to a sound frequency that had evoked a response in control. h, Average effect of ZX1 (red) on the sound-evoked response amplitudes of A1 L2/3 PV neurons to tones with frequencies within 1 octave from BF [control (black) vs ZX1; 50 dB SPL, p = 0.002; 70 dB SPL, p = 0.0007]. i, Average effect of ZX1 (red) on the sound-evoked response amplitudes of A1 L2/3 PV neurons to tones with frequencies >1 octave away from BF [control (black) vs ZX1; 50 dB SPL, p = 0.007; 70 dB SPL, p = 0.012]. For all panels, asterisks indicate significant differences after accounting for multiple comparisons using the Holm-Bonferroni's correction; error bars indicate SEM. Detailed values and staticistcal test are listed in the Materials and Methods.
