Figure 4.
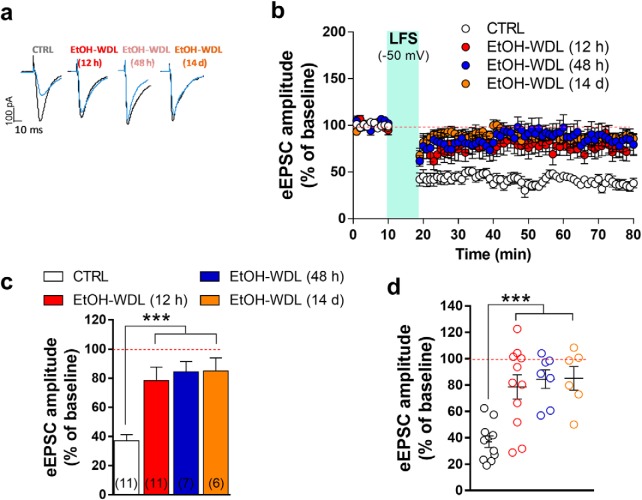
Effects of EtOH withdrawal on LTD formation in rat NAc MSNs. AMPAR-mediated eEPSCs were recorded in single voltage-clamped (−65 mV) MSNs of the NAc shell obtained from the different groups of animals [n of animals: CTRL = 5; EtOH-WDL (12 h) = 5; EtOH-WDL (48 h) = 4; EtOH-WDL (14 d) = 3]. a, Representative eEPSCs recorded before (black trace) and 60 min after (blue trace) LFS paired with depolarization (−50 mV). b, Scatter plot graph of the changes in eEPSC amplitude in CTRL and EtOH-WDL (12 h, 48 h, and 14 d) with data expressed as percentage of baseline. c, The graph illustrates the degree of LTD, calculated by averaging the eEPSC amplitude values measured 50–60 min after LFS and expressed as percentage of baseline. The number of cells analyzed is indicated for each group. ***p = 0.0004. d, The scatter graph illustrates the distribution of individual values, averaged in c. Color code is the same as in c. ***p = 0.0006.

