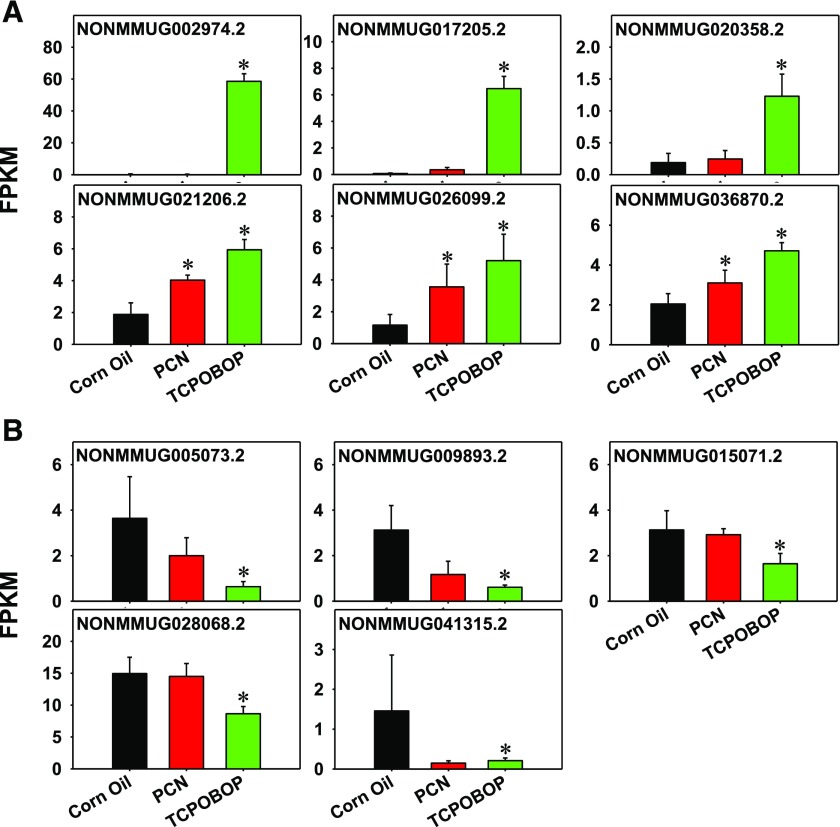
Fig. 6.
Examples of hepatic lncRNAs that were upregulated (A) or downregulated (B) by TCPOBOP (which are consistent with the literature report of Lodato et al., 2017). The effect of PCN on these CAR-targeted lncRNAs is also shown. Asterisks represent statistically significant differences compared with the corn oil group (P < 0.05, Cufdiff). FPKM a unit to express RNA abundance from the RNA-Seq data.

