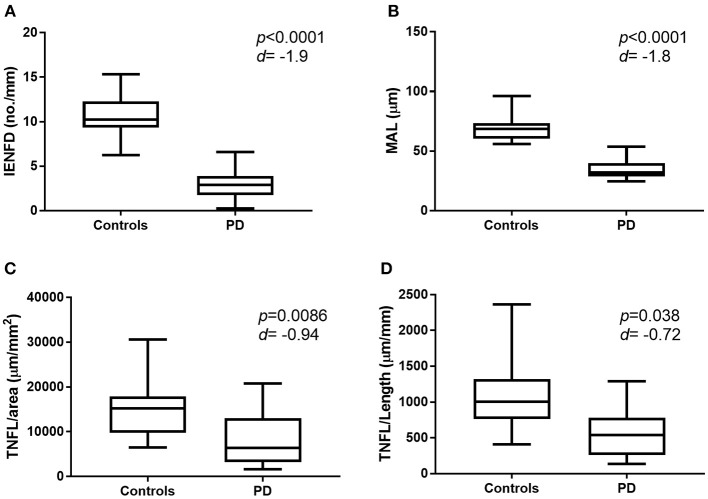
Figure 2.
Graphic representation of nerve fiber measurement in healthy control subjects and patients with PD. Box and whisker plot showing mean, min and max values for IENFD (A), MAL (B), IETNFL/Area (C), and IETNFL/Length (D). Two-tailed unpaired Mann-Whitney rank test was used to compare means between control and PD nerve fiber measurements. P-value and effect size (d) shown (d > 0.5 = medium effect; over 1.0 = large effect). IENFD, intraepidermal nerve fiber density; MAL, mean axonal length; IETNFL, intraepidermal total nerve fiber length.

