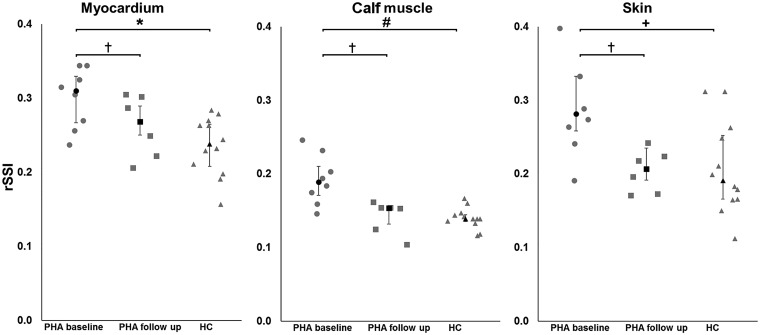
Figure 2.
Relative sodium signal intensities (rSSI) in patients with primary hyperaldosteronism (PHA) at baseline (n = 8) and follow-up (n = 6) and in healthy controls (HC; n = 12) in the interventricular septum, calf muscle, and skin. ●, ▪, and ▴ represent medians; error bars represent the 25th/75th percentile (*Pseptum = 0.007; #Pcalf muscle = 0.001; +Pskin = 0.014; †Pbaseline vs. FUP <0.05).

