Figure 1.
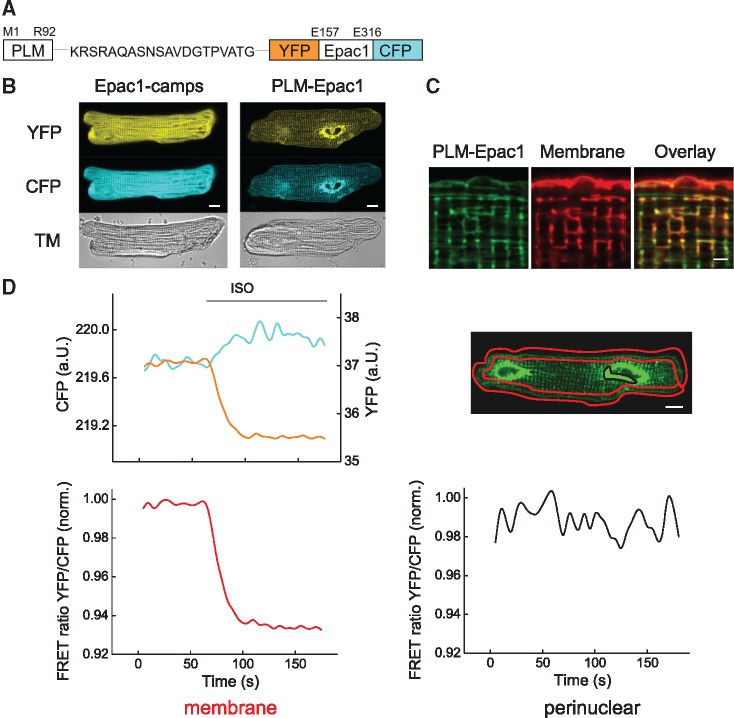
Generation of a targeted PLM-Epac1 biosensor. (A) Schematic representation of the PLM-Epac1 sensor construct that includes full-length phospholemman (PLM) fused via a flexible linker to the parental cytosolic cAMP biosensor Epac1-camps comprised of the cAMP-binding domain sandwiched between enhanced yellow fluorescent protein (YFP) and enhanced cyan fluorescent protein (CFP). (B) Representative confocal images of adult rat ventricular myocytes (ARVMs) transduced with adenoviral constructs to express Epac1-camps or PLM-Epac1. Fluorescence in YFP and CFP channels reveals sarcolemmal and partially striated intracellular membrane localization pattern for PLM-Epac1, as compared to the cytosolic Epac1-camps. See Supplementary material online, Figure S3 for autofluorescence image. (C) Representative confocal image (n = 10) showing live cell membrane staining of PLM-Epac1 expressing ARVM. Scale bar 2 µm. (D) Representative FRET recording (n = 10) of a PLM-Epac1 expressing ARVM stimulated with the β-adrenergic agonist isoproterenol (ISO 100 nmol/L). Left, YFP, and CFP intensities measured in a red-marked membrane region of interest to exclude strongly fluorescent perinuclear overexpression show concomitant changes, indicative of a decreasing YFP/CFP FRET ratio (here normalized to the basal ratio values) which represents an increase of local cAMP levels upon ISO treatment. In contrast, no detectable FRET change could be observed in perinuclear location (marked black) with sensor overexpression (right). Scale bars 10 µm. TM, transmission image.

