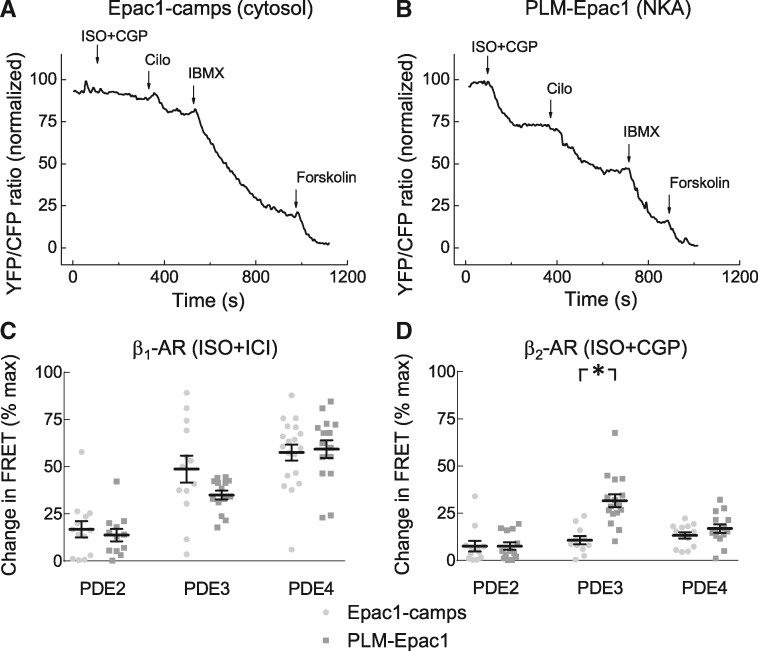
Figure 4.
PDE regulation of cytosolic and local cAMP levels under subtype specific β-AR stimulations. Representative FRET ratio traces for Epac1-camps (A) and PLM-Epac1 (B) expressing ARVMs recorded during selective β2-AR stimulation with 100 nmol/L ISO plus 50 nmol/L CGP20712A followed by the PDE3 inhibitor cilostamide (Cilo, 10 µmol/L) and the unselective PDE inhibitor IBMX (100 µmol/L). Forskolin (10 µmol/L) was used to fully stimulate the sensors. (C) Quantification of the PDE inhibitor responses in cells with prestimulated β1-AR. 100 nmol/L BAY 60-7550 and 10 µmol/L rolipram were used to inhibit PDE2 and PDE4, respectively. Shown are means ± SE, number of cells (n), and hearts (N) per condition were as follows—n/N = 13/4 and n/N = 14/5 for PDE2, n/N = 13/4 and n/N = 16/5 for PDE3, and n/N = 19/3 and n/N = 15/9 for PDE4, respectively. (D) Quantification of the PDE inhibitor responses in cells with prestimulated β2-AR. Means ± SE, number of cells (n), and hearts (N) per condition were as follows—n/N = 12/4 and n/N = 13/4 for PDE2, n/N = 11/4 and n/N = 16/4 for PDE3, and n/N = 13/4 and n/N = 14/4 for PDE4, respectively. *—significant differences, P < 0.05 by mixed ANOVA followed by Wald χ2-test. P 0.05 by the same test. n.s., not significant.

