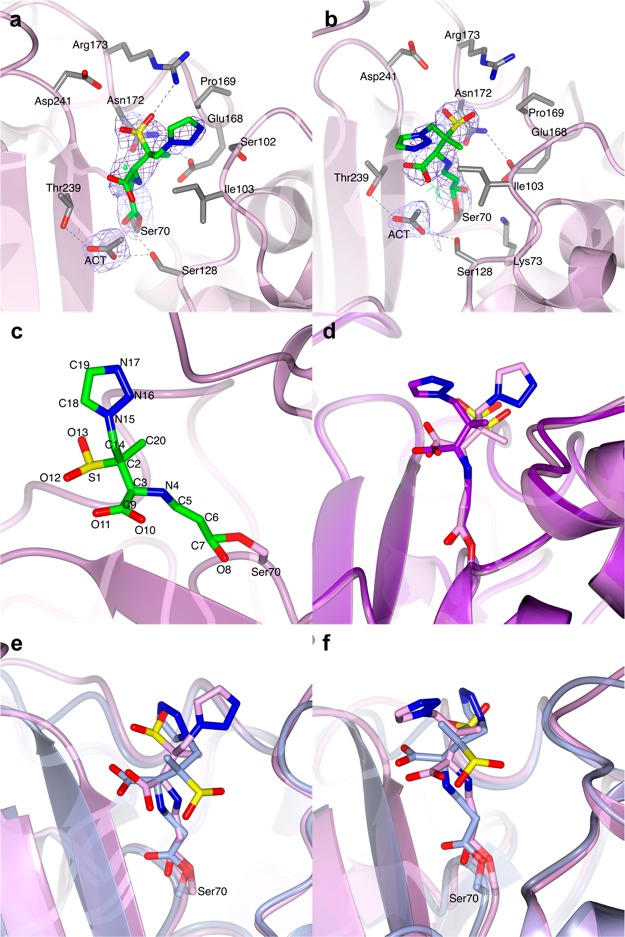
Figure 5.
Structure of the covalent BlaC complex with tazobactam. In both chain A (a) and chain B (b) of the AU, the covalent adduct was modeled as a trans-enamine derivative of tazobactam. BlaC is in ribbon representation. The covalent tazobactam adducts are in stick representation colored according to atom type (C in green, O in red, N in blue, and S in yellow). The residues that are at a distance < 4 Å are also represented as sticks with C atoms colored in gray. The 2mFo-DFc electron density map (blue chicken wire with a contour level of 1 σ) is clipped on the covalent adducts and acetate ion (ACT) near Ser128. (c) Closer view of the trans-enamine adduct of chain B with the numbering of the atoms indicated by the labels. (d) Superposition of the trans-enamine adduct modeled in chain A (lilac) and chain B (purple). (e), (f) Structural comparison of the tazobactam trans-enamine adducts bound to SHV-1 (PDB 1VM1, ice blue) and to BlaC (lilac) chain A (e) and chain B (f).

