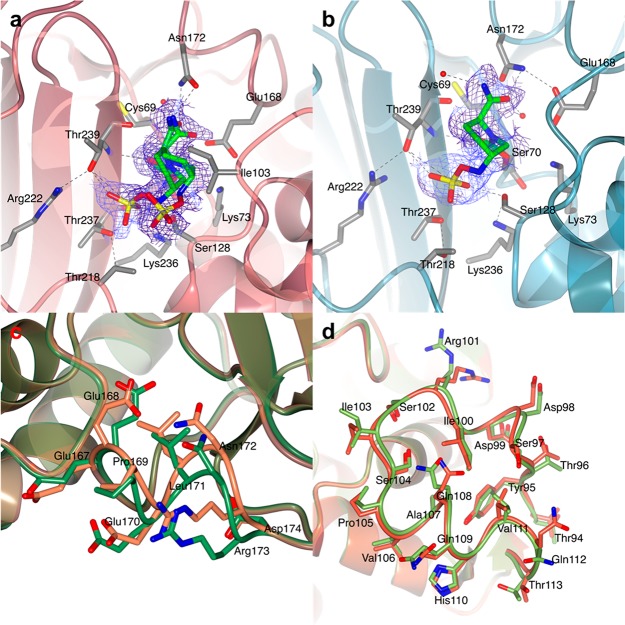
Figure 6.
BlaC in complex with avibactam. The avibactam carbamyl adducts in chains A (a, red) and B (b, teal) of the AU of BlaC crystals are shown. The structure of BlaC is in ribbon representation, and the residues involved in binding and stabilization of the covalent adduct are represented as sticks (C in gray, O in red, N in blue, and S in yellow). The covalent adduct of avibactam is also represented as sticks with C colored in green. (a) Active site of chain A. Avibactam could be modeled in two conformations. (b) In chain B, the avibactam-derived covalent inhibitor was found only in one conformation, in which the sulfate moiety is hydrogen bonded to Ser128, Thr237, and Thr239. In both images, the 2mFo-DFc electron density map (blue chicken wire with a contour level of 1 σ) is centered on the avibactam adducts. (c and d) Comparison of the structures of BlaC in complex with avibactam and of free BlaC (PDB 5OYO). Both structures are in ribbon representation. (c) Close view of the shifted loop of chain A (residues 167–174) in the structure of BlaC in complex with avibactam (lawn green) superposed to free BlaC (PDB 5OYO, coral). The side chains of residues 167–174 are shown as sticks colored according to atom type (O in red, N in blue, and C in lawn green and coral for BlaC–avibactam and free BlaC, respectively). (d) Detail of the structural superposition of chain B of BlaC–avibactam (green) with chain B of free BlaC (red).

