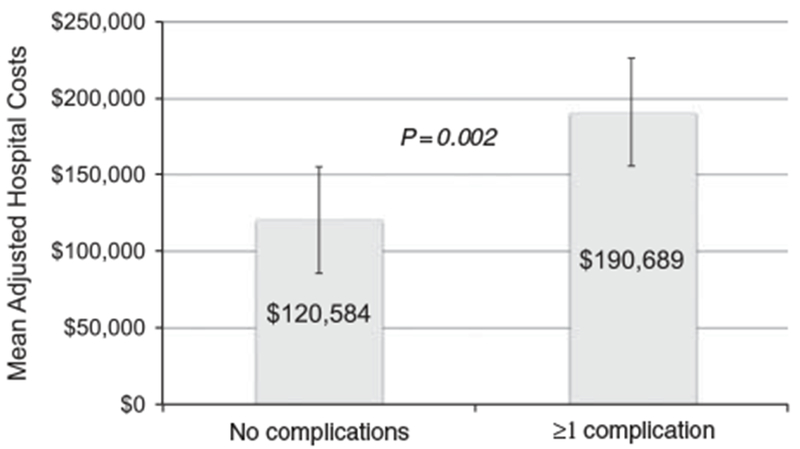
Figure 2.

Association of complications and mean adjusted hospital costs following the Norwood operation. Hospital costs were adjusted for significant baseline patient characteristics. The X-axis separates patients into those with no complications versus those with at least one postoperative complication. The mean adjusted hospital costs are displayed on the Y-axis.
