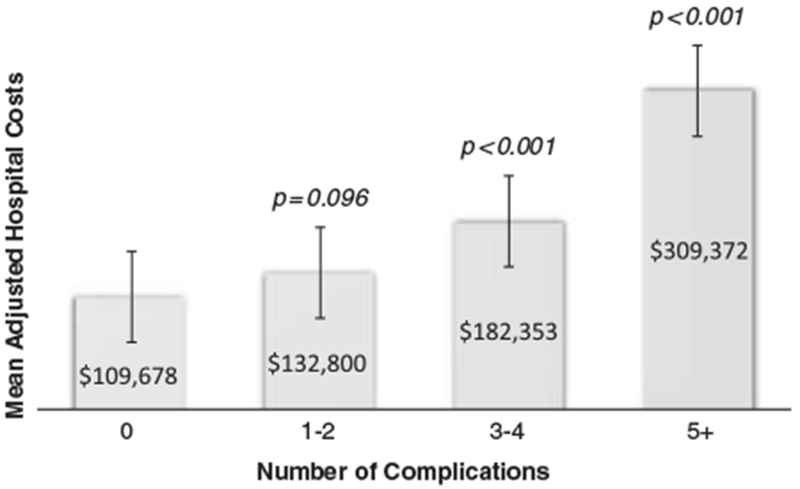
Figure 3.

Mean adjusted hospital costs increase with complications rates following the Norwood operation. Total hospital costs were adjusted for baseline patient characteristics. Patients were grouped by the number of post-Norwood complications on the X-axis, and the mean adjusted hospital costs are displayed on the Y-axis.
