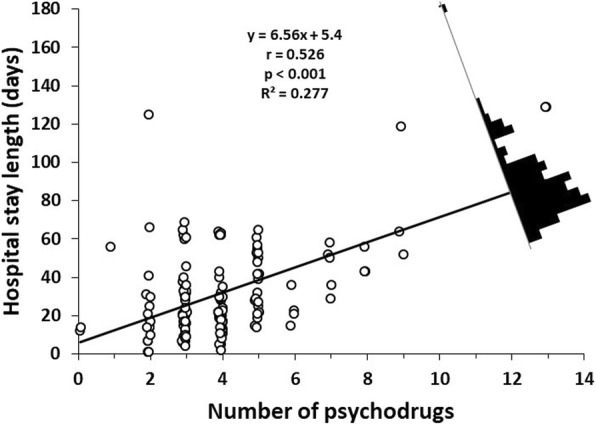
Fig. 1.

Linear regression of “Hospital stay length (days)” and “Number of psychodrugs”. The residual distribution is represented by the black histogram. In the superior central white area it is presented the linear regression function, the correlation (r), p value for the significant test of the correlation and the determination coefficient (R2)
