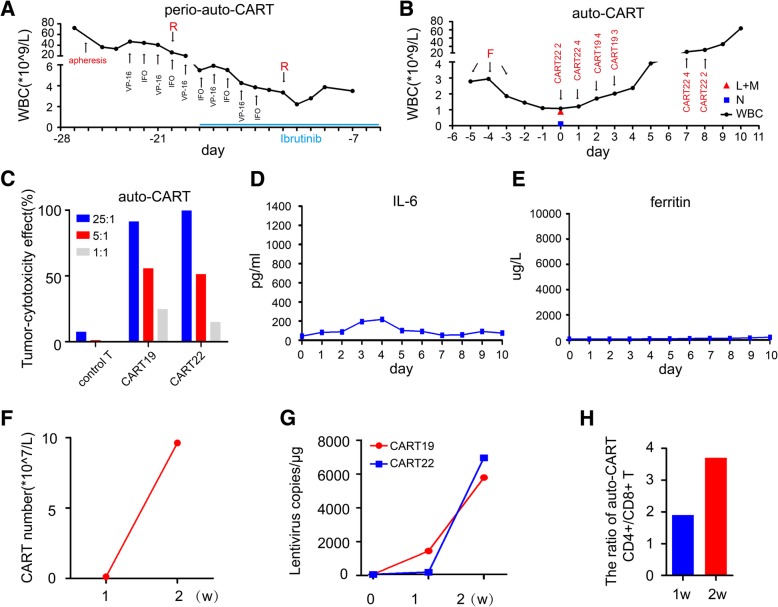
Fig. 1.
The failure of autologous CAR T cell therapy. a Treatments and the white blood cell changes during perio-autologous CAR T cell therapy. The first infusion day of autologous CAR T cells was as day 0, apheresis was used at day − 26 and rituximab (R) 375 mg/m2 was used at day − 20 and − 12 before infusion of CAR T cells (red font). Etoposide (VP-16) 100 mg and ifosfamide (IFO) 1 g were used alternately between day − 23 and day − 14 before infusion (black font). The treatment with ibrutinib 560 mg daily was between day − 18 and day − 5 before infusion (blue line). b Treatments and the white blood cell changes during autologous CAR T cell therapy. The red triangle represents the number of lymphocytes (L) and monocytes (M), blue square represents the level of neutrophile granulocytes (N). Fludarabine (F) 25 mg/m2 was used on day − 5 and − 3 before infusion (red font). Autologous CART22 was infused on day 0, day 1, day 7 and day 8, while autologous CART19 was infused on day 2 and day 3. c In vitro tumor-cytotoxicity effect of autologous CART19 and CART22 cells at an effector/target ratio of 25:1, 5:1 and 1:1 respectively. d and e Levels of IL-6 and ferritin during autologous CAR T cell therapy. f and g CAR T cell number and copies of lentivirus-containing CAR in the peripheral blood detected by flow cytometry and ddPCR after autologous CAR T cell therapy. h The ratio of CD4+/CD8+ T cells in the peripheral blood was 1.9 on day 7 and 3.7 on day 14

