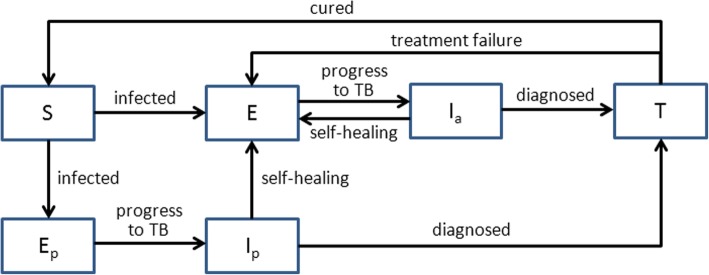
Fig. 1.
Block diagram of pulmonary tuberculosis transmission. Legend: S represents susceptible individuals who have not been infected with M. tuberculosis; E represents individuals who are infected with M. tuberculosis but have not developed the disease; Ia represents patients with secondary pulmonary tuberculosis who have symptoms but have not yet received treatment; Ep represents infected individuals who are in the incubation period; Ip represents primary tuberculosis patients who have symptoms but have not yet received treatment; and T represents patients who are being treated

