Fig. 3.
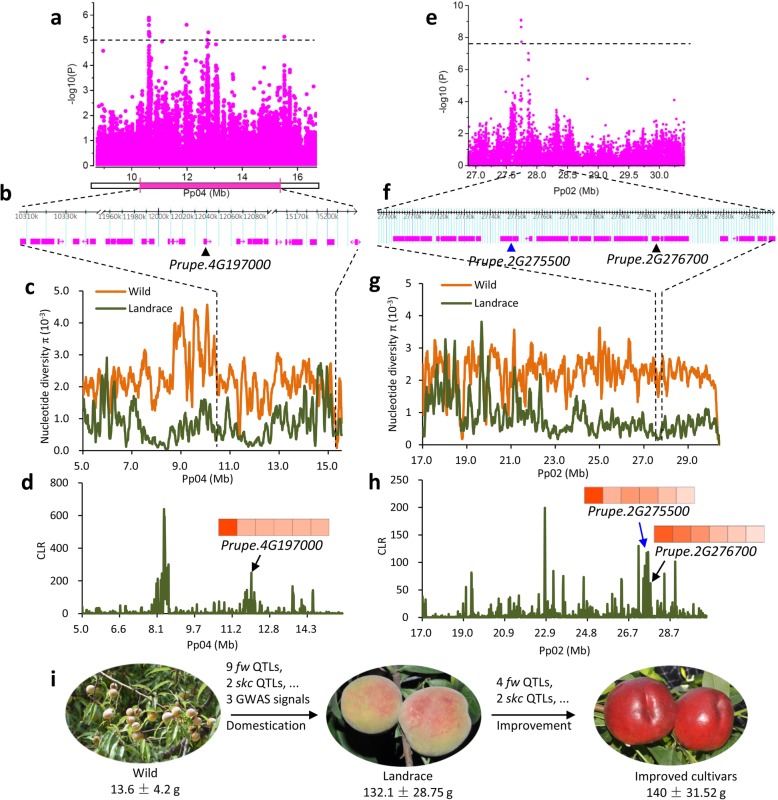
Evolution of fruit size during domestication and improvement in peach. a–d Selection on the fw QTL on chromosome 4 during peach domestication. a Regional Manhattan plot of GWAS for fruit size and the corresponding co-located QTL related to fruit size on chromosome 4. Although no signal exceeded the Bonferroni significance threshold of GWAS (P < 3.2 × 10− 8), a secondary GWAS signal was identified (P < 1× 10− 5). b Gene models in the fruit size related QTL on chromosome 4. The candidate gene, Prupe.4G197000, is labeled with a black triangle. c Nucleotide diversity (π) of the interval of the fruit size related QTL. d CLR value of the interval of the fruit size related QTL. A heat map of the expression level of Prupe.4G197000 during different stages of fruit development (20, 40, 60, 80, 100, and 120 days after bloom from left to right) is shown. e–h Selection on the fruit weight GWAS signal on chromosome 2 during domestication. e Regional Manhattan plot of GWAS for fruit size on bottom of chromosome 2. The gray horizontal dashed line indicates the Bonferroni significance threshold of GWAS (P < 3.2 × 10− 8). f Gene models in the fruit size QTL region on chromosome 2. Candidate genes, Prupe.4G275500 and Prupe.2G276700, are indicated with blue and black triangles, respectively. g Nucleotide diversity (π) of the fruit size QTL region. The selection for big fruit size has led to the hitchhiking of a nearly 10-Mb region on the bottom of chromosome 2. h CLR value of the fruit size QTL region. The heat map shows gene expression levels of Prupe.4G275500 and Prupe.2G276700. i Schematic diagram of the two-step evolution of peach fruit size. The change of fruit appearance and related QTL (skc) is also shown. QTLs and GWAS signals that were putatively selected during domestication and improvement are indicated

