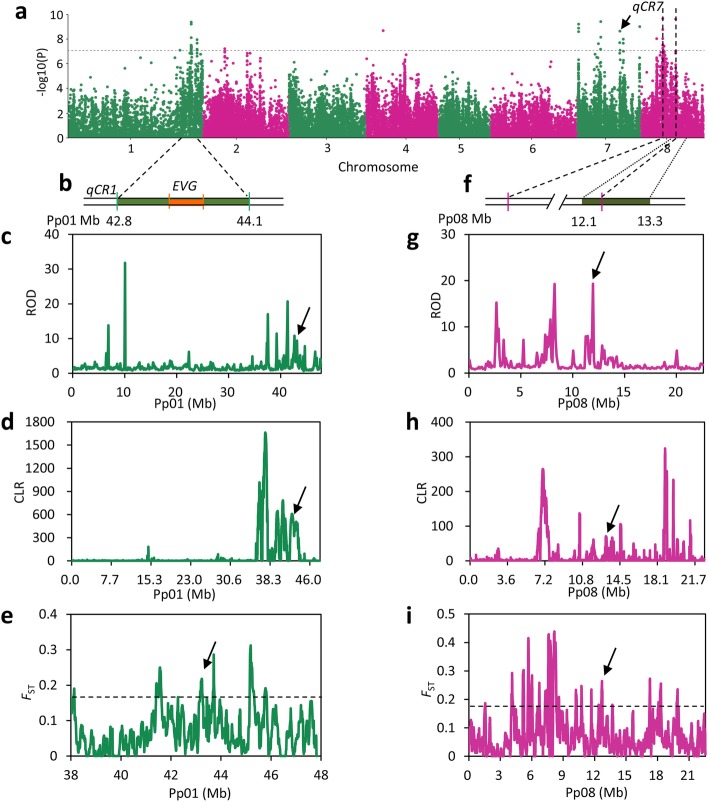
Fig. 5.
Selection targets for low CR breeding. a Manhattan plot of GWAS for CR. The gray horizontal dashed line indicates the Bonferroni significance threshold of GWAS (P < 4.1 × 10− 8). b Physical location of CR QTL and the EVG locus on chromosome 1. The green and orange rectangles represent CR QTL and the EVG locus, respectively. c–d Distribution of ROD (c) and CLR (d) values across chromosome 1 using 100-kb non-overlapping sliding windows. The CR QTLs are pointed by black arrows. e Distribution of FST values between landrace and low CR improved cultivars in the qCR1 genomic region. The black horizontal dashed line indicates the top 5% of genomic regions with highest FST. f Physical location of the CR QTL on chromosome 8. The green rectangle represents previous CR QTL. g–h Distribution of ROD (g) and CLR (h) values across chromosome 8 using 100-kb non-overlapping sliding windows. The CR QTLs are pointed by black arrows. i Distribution of FST values between landrace and low CR improved cultivars in the qCR8 genomic region. The gray horizontal dashed line indicates the top 5% of genomic regions with highest FST

