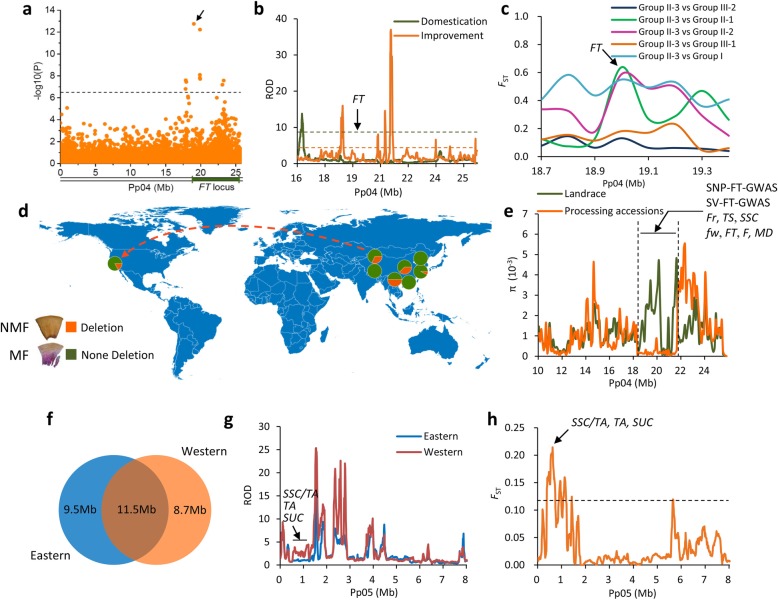
Fig. 6.
Divergent selection on flesh texture and local breeding. a Regional Manhattan plots of GWAS for flesh texture on chromosome 4. The top signal of GWAS was highlighted using a black arrow. b Distribution of ROD values during domestication and improvement in the association region. The green and orange horizontal dashed lines indicate 5% cut off of ROD value during domestication and improvement, respectively. c Distribution of FST values between different groups in the association region. The FT QTL was highlighted using a black arrow. d Geographical pattern of the allele frequencies at the causal polymorphisms (top signal of GWAS). The orange dashed line with arrow represents the putative spread route of peaches with non-melting fruit flesh. MF and NMF represent melting and non-melting flesh texture, respectively. e Comparison of nucleotide diversity of between landraces and processing peach cultivars. A nearly 4-Mb strong selective sweep (between two dashed vertical bars) was highlighted and annotated. The QTLs and GWAS signals in this region are indicated. Fr, fruit firmness; FT, flesh texture; F, flesh adhesion; MD, maturity date. f Venn diagram showing sizes of shared and unique genome regions under selection in eastern and western improved cultivars. g Distribution of ROD values of eastern and western improved cultivars at the top of chromosome 5. Three QTLs, including SSC/TA, TA, and suc, in western-specific selective sweeps are labeled. h Distribution of FST between eastern and western improved cultivars at the top of chromosome 5. Three QTLs, including SSC/TA, TA, and suc, in western-specific selective sweeps are labeled. The horizontal dashed line indicates the 5% cut off

