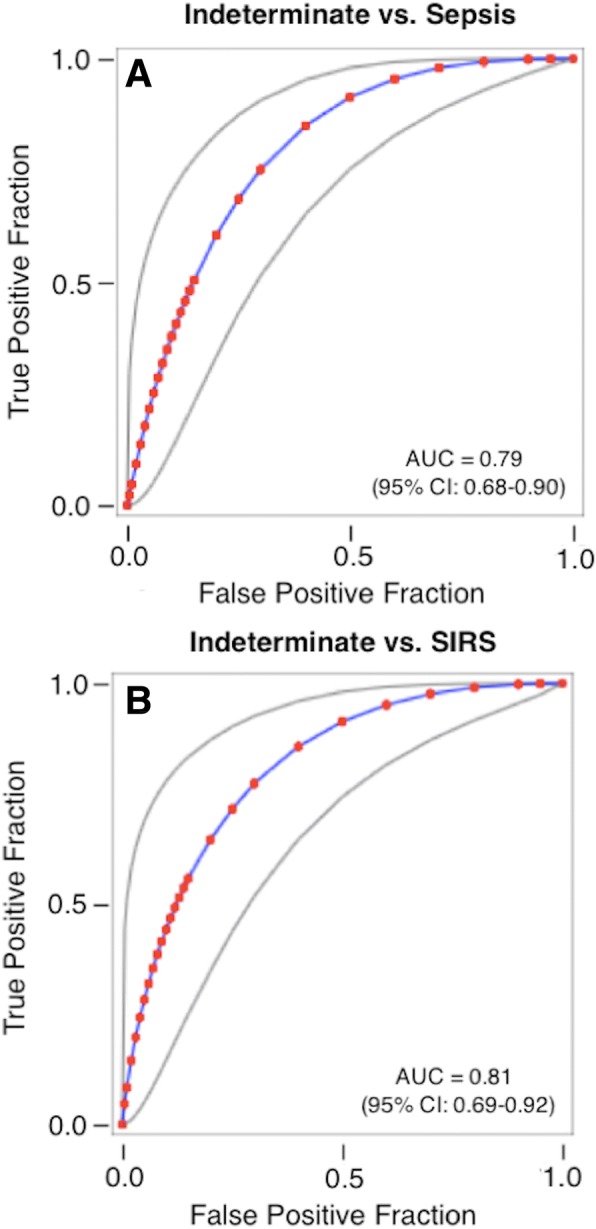
Fig. 3.

Logistic regression analysis to distinguish indeterminates from patients with either sepsis or SIRS. a Logistic regression model for sepsis vs. indeterminates. The model used consensus discharge diagnosis by the site investigators as the comparator and analyzed 64 septic patients and 23 indeterminates. The predictor variable is given by the following equation: y = 0.4249 + 0.3672 * SeptiScore + 0.1232 * WBC.Max − 0.0245 * WBC.Min − 0.0269 * MAP.Max. This equation gives AUC = 0.79 (95% CI 0.68–0.90) in ROC curve analysis. b Logistic regression model for SIRS vs. indeterminates. The model used consensus discharge diagnosis by the site investigators as the comparator and analyzed 73 SIRS patients and 15 indeterminates. The predictor variable is given by the following equation: y = 3.1742–0.2548 * log2 PCT − 0.3913 * SeptiScore. This equation gives AUC = 0.81 (95% CI 0.69–0.92) in ROC curve analysis. Additional file 6 provides further details of the analysis. Abbreviations: AUC, area under curve; MAP.Max, maximum mean arterial blood pressure; PCT, procalcitonin; ROC, receiver operating characteristic curve; WBC.Max, maximum white blood cell count; WBC.Min, minimum white blood cell count
