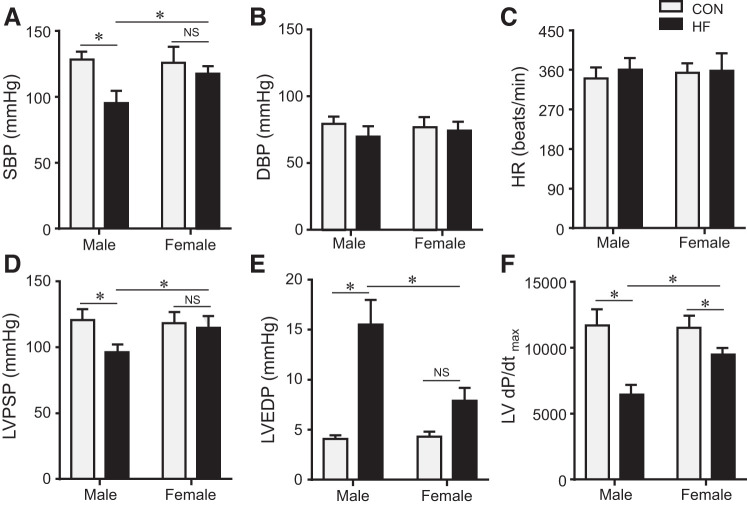
Fig. 3.
Quantitative comparison of hemodynamic parameters including systolic blood pressure (SBP; A), diastolic blood pressure (DBP; B), heart rate (HR; C), left ventricular (LV) peak systolic pressure (LVPSP; D), LV end-diastolic pressure (LVEDP; E) and maximum rate of rise of LV pressure (LV dP/dtmax; F) from control (CON) and heart failure (HF) rats of both sexes at 4 wk after coronary artery ligation. Data are means ± SE; n = 6–13 for each group. NS, not significant. *P < 0.05.

