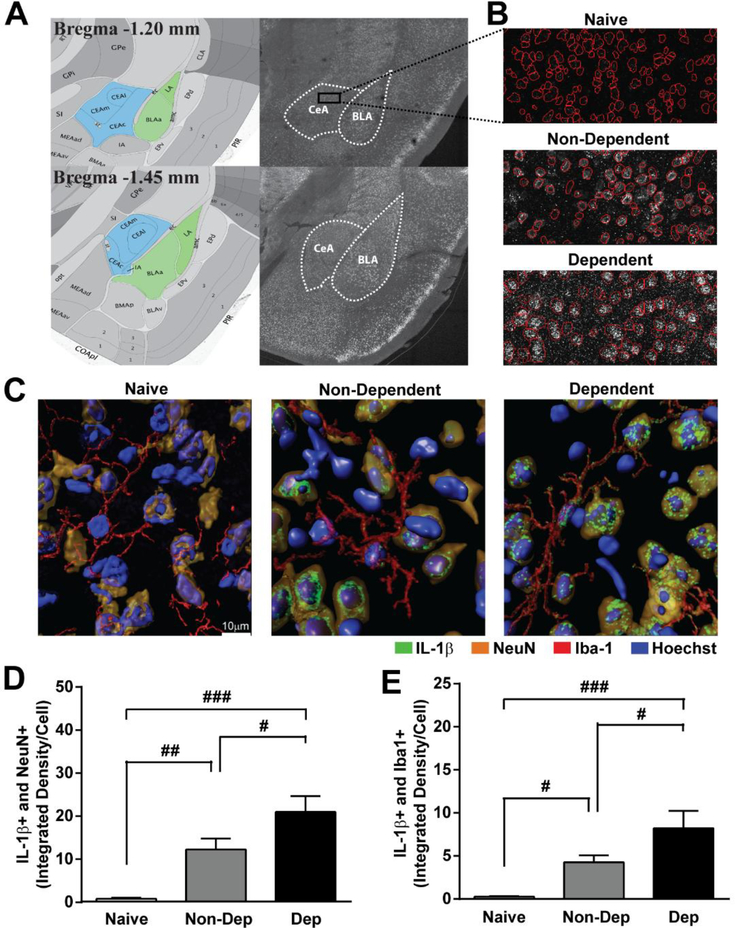
Figure 2. IL-1β expression in neurons and microglia in the CeA of naïve, non-dependent and dependent mice.
A. Allen Mouse Brain Altas images and corresponding serial tiled and stitched confocal image depicting the amygdala including the central nucleus of the amygdala (CeA, blue) and basolateral amygdala (BLA, green). B. 40X magnified panel from outlined CeA showing IL-1β staining and auto-traced cell body outlines (red) from naïve (top), Non-Dep (middle) and Dep (bottom) mice. C. Representative 3D rendered 63X confocal images of IL-1β (green) co-labeling with NeuN (orange) and Iba-1 (red) in the CeA of naïve (left), Non-Dep (middle), and Dep (right) mice. D and E. Quantification of IL-1β co-labeling with NeuN and Iba1, respectively in naïve, Non-Dep, and Dep mice. ###, p < 0.001; ##, p < 0.01; #, p < 0.05 by one-way ANOVA with Tukey post-hoc test for multiple comparisons.

