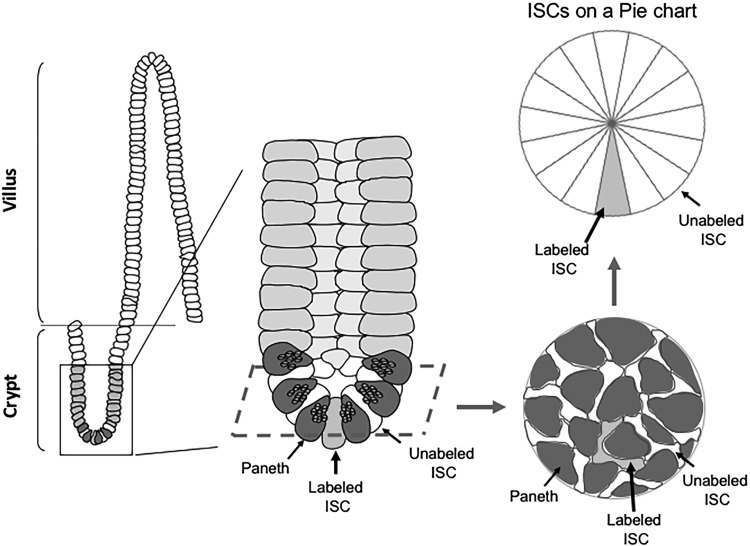
Fig. 1.
Acquisition of clonal growth data for intestinal stem cells (ISCs) by lineage tracing. A tamoxifen-inducible Cre/loxp system genetically labels ISCs and allows us to trace-labeled ISCs in each crypt based stem cell compartment. An intestinal crypt (enlarged in the middle) in the crypt-villus model (on the left) and the positions of unlabeled ISCs (white) and a labeled ISC (gray) between the Paneth cells (dark gray) at the bottom of the crypt is illustrated. Investigators acquired a number of images from tissue sections at different time points after tamoxifen administration for later clonal growth analysis (an example of realistic view is illustrated on the right bottom). For conceptual understanding, we use a pie chart to illustrate growth of the ISC clone (right top). The pie represents a single ISC clone as a 1-dimensional circle of ISCs. The average number of total ISCs in a single crypt is 16; therefore, 16 pies are needed to represent each potential ISC clone. Here the initial condition of clonal growth, i.e., 1 labeled ISC and 15 unlabeled ISCs are shown in this pie chart.

