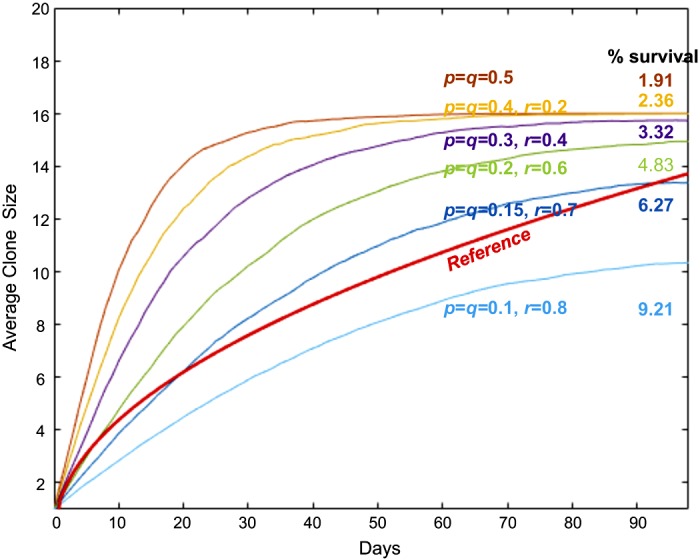
Fig. 6.

In silico growth of intestinal stem cell (ISC) clones based on branching process model. In silico growth curves with different p, q, and r values. Simulations of 50,000 clones were performed for each curve. The reference curve, the mean values between and is shown by the red solid line.
