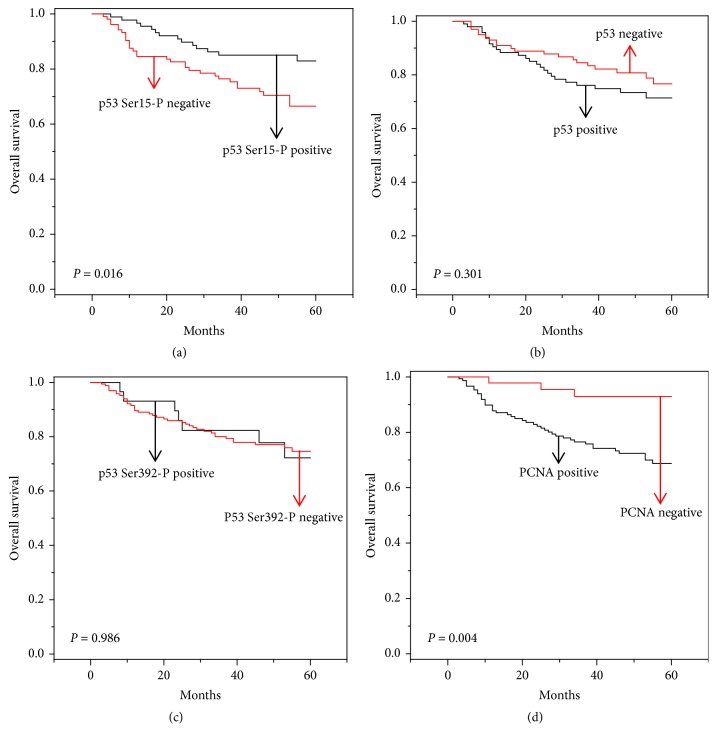
Figure 2.
Five-year overall survival (OS) curves of HCC patients with positive or negative expression of p53, p53 Ser15-P, p53 Ser392-P, and PCNA by Kaplan-Meier Curve. Black lines are the positive individuals, and red lines are the negative individuals. (a) OS graph of p53 Ser15-P–positive and –negative individuals. (b) OS graph of p53-positive and -negative individuals. (c) OS graph of p53 Ser392-P–positive and –negative individuals. (d) OS graph of PCNA-positive and -negative individuals. P, P value from log rank tests.

