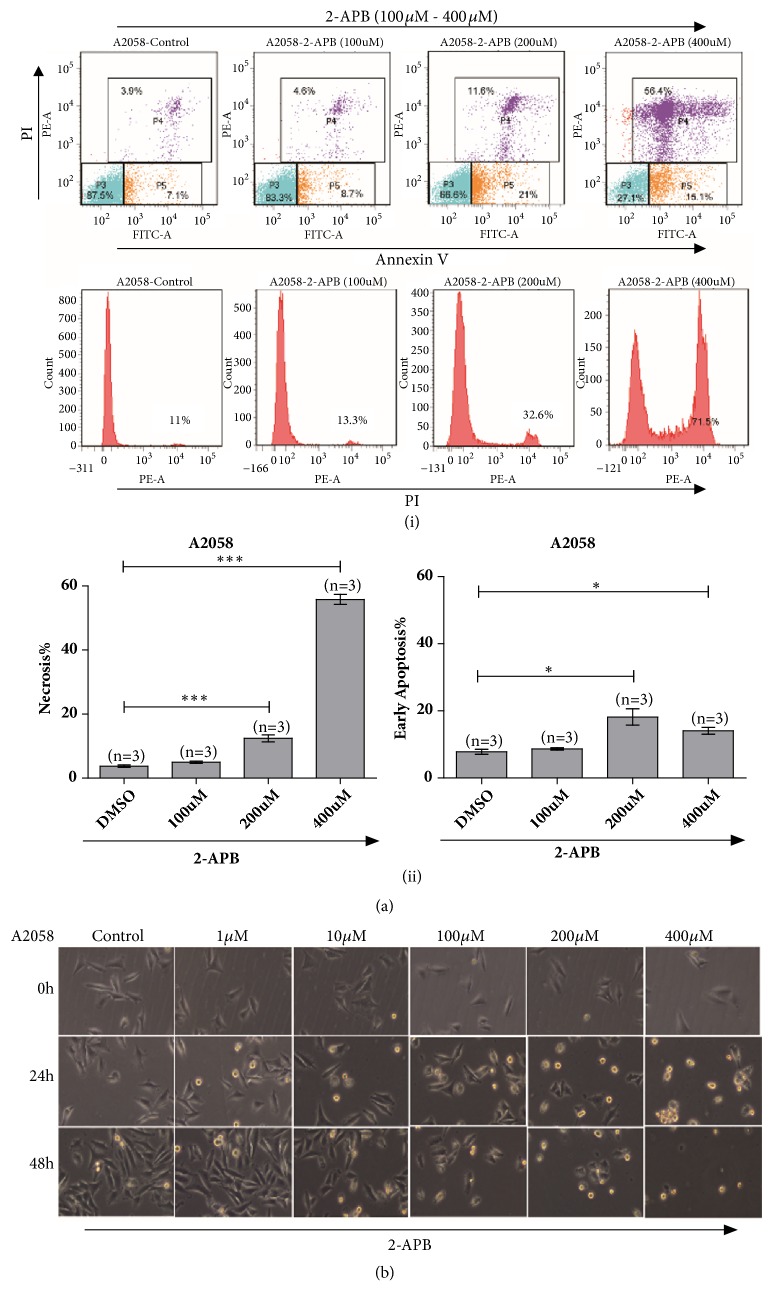
Figure 3.
TRPV2 activation dominated A2058 melanoma cells undergoing necrosis. (a) Flow cytometry analysis via FITC-Annexin V and PI staining showed A2058 melanoma cells with 2-APB (100 μM, 200 μM, and 400 μM) treatment undergoing necrosis and enhanced apoptosis (i) & (ii). (b) Morphology measurement by microscopic imaging for A2058 melanoma cells with 2-APB (1 μM, 10 μM, 100 μM, 200 μM, and 400 μM) treatment exhibited prominent necrotic and apoptotic cells.

