Figure 5.
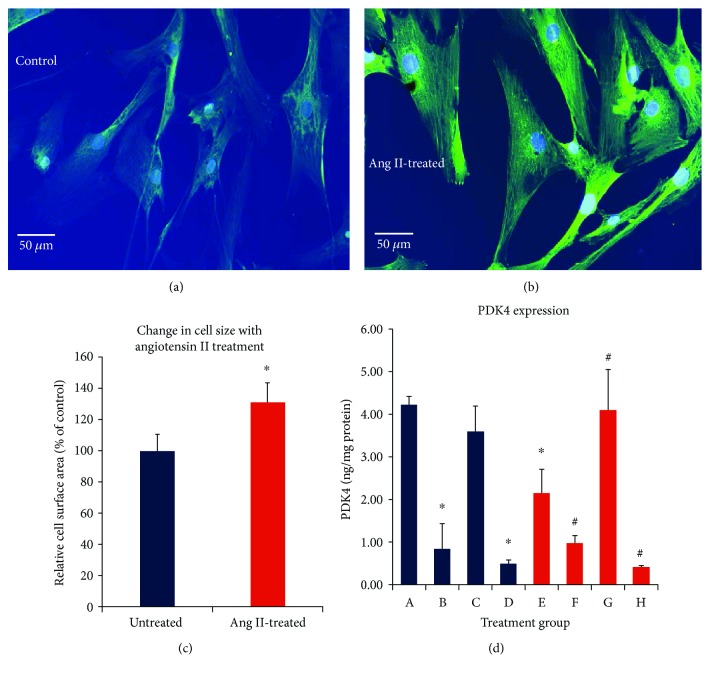
A-H. In vitro culture model of human ventricular cardiomyocytes (groups A-D = control; groups E-H = 0.1 μM Ang II). (a) Control. (b) Ang II-dependent cardiomyocyte hypertrophy. Cardiomyocytes are stained with sarcomeric α-actinin (1 : 100) and DAPI (nuclear blue dye). (c) Summary of Ang II-dependent increases in the cell surface area after a 24 hr exposure averaged from 50 cells per treatment group in 3 independent experiments, ∗p < 0.05 vs Ang II. (d) PDK4 cell protein levels following 30 min treatments with: group A-cell media only; group B-DCA (0.2 mM); group C-NADH (0.6 mM) + acetyl-CoA (50 μM); group D-pyruvate (5 mM); group E-Ang II only (0.1 μM, 24 hrs); group F-Ang II + DCA (0.2 mM); group G-Ang II + NADH (0.6 mM) + acetyl-CoA (50 μM); group H-Ang II + pyruvate (5 mM). ∗p < 0.05 vs. group A, #p < 0.05 vs group E, mean ± SD, n = 3 independent experiments.

