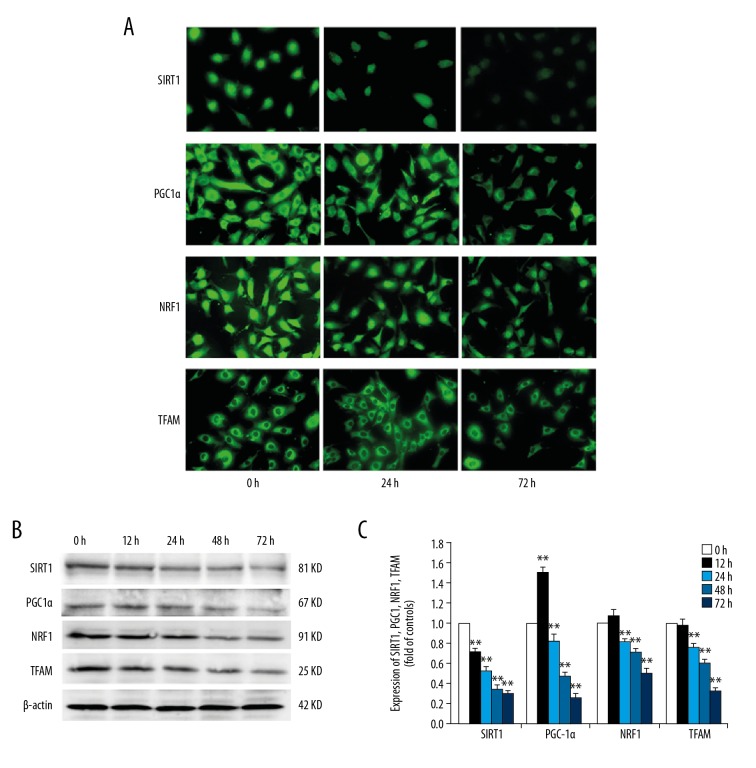
Figure 1.
Effects of high glucose on the expression of SIRT1, PGC-1α, NRF1, and TFAM in podocytes. Podocytes were incubated with 5.6 mM glucose (NG group), 5.6 mM glucose plus 24.4 mM mannitol (M group), or 30 mM glucose (HG group) for 72 h. (A) SIRT1, PGC-1α, NRF1, and TFAM expression were detected using immunocytochemical staining at different time points (0, 12, 24, 48, and 72 h). (×200). (B) The expression levels of SIRT1, PGC-1α, NRF1, and TFAM were detected by Western blot analysis, and the relative intensities were normalized against β-actin. (C) The expression levels of SIRT1, PGC-1α, NRF1, and TFAM mRNA were analyzed by real-time PCR. The values are expressed as mean ±SD (n=6). * P<0.05, ** P<0.01 vs. control group.

