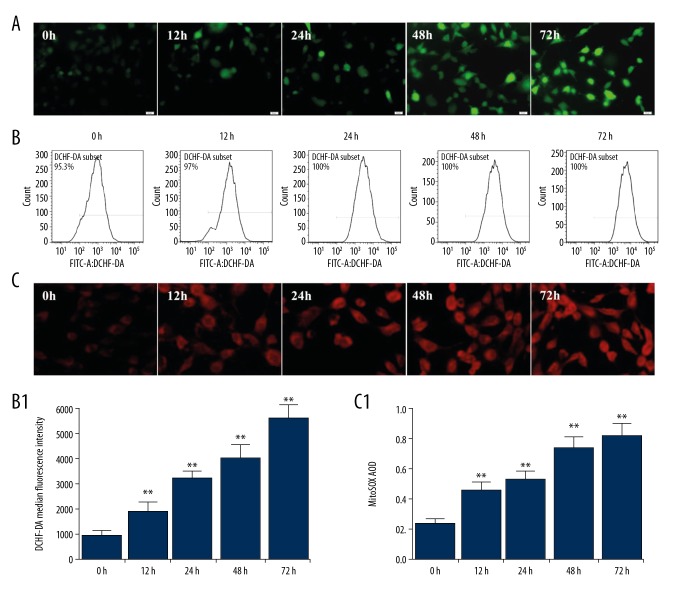
Figure 2.
Effects of high glucose on the intracellular and mitochondrial ROS production in podocytes. Podocytes were incubated with 5.6 mM glucose (NG group), 5.6 mM glucose plus 24.4 mM mannitol (M group), and/or 30 mM glucose (HG group) for 72 h. (A) The intracellular ROS production in podocytes was detected by DCHF-DA staining (×400). (B, B1) The intracellular ROS production in podocytes was detected by flow cytometry. (C, C1) HG-induced mitochondrial ROS production in podocytes was evaluated by MitoSOX. The values are expressed as mean ±SD (n=6). ** P<0.01 vs. control group (0 h).

