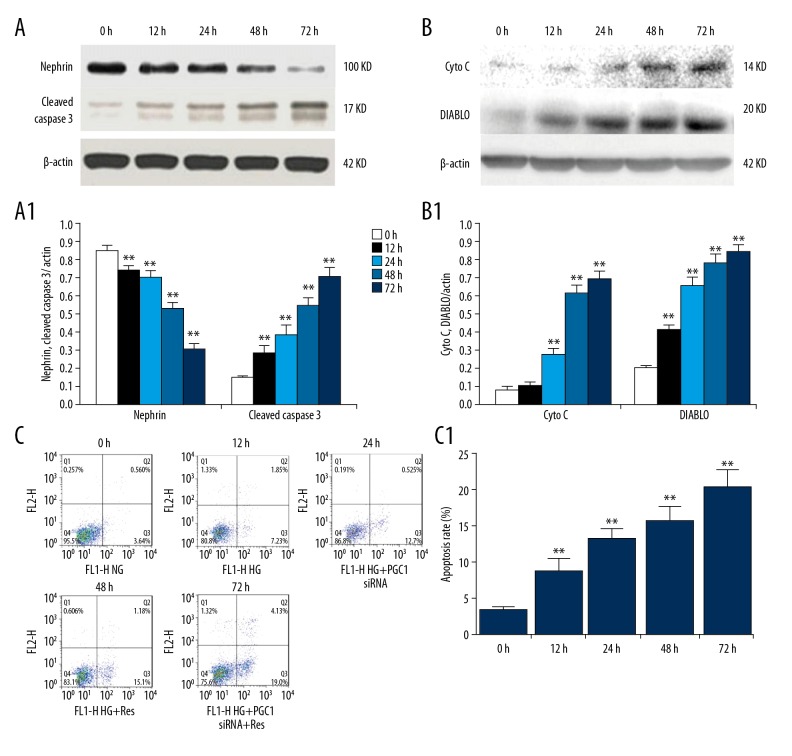
Figure 3.
Effects of high glucose on nephrin expression and apoptosis induction in podocytes. (A, A1) The expression of cleaved caspase-3 and nephrin were analyzed by Western blotting. (B, B1) Western blot analysis of cytochrome C and DIABLO in cytosolic fractions of podocytes. The relative intensities were normalized against β-actin. (C, C1) Apoptosis was detected by flow cytometry. The values are expressed as mean ±SD. ** P<0.01 vs. control group.

