
Figure 1.
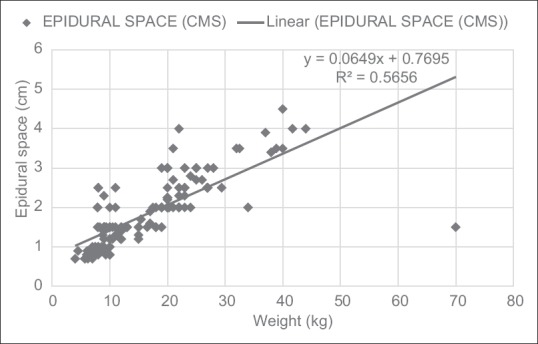
Graph showing linear correlation between skin–epidural space distance and weight. Weight in kg on x axis; skin–epidural space distance in cm on y axis. Correlation measured using Pearson's (R2) correlation coefficient. Mean weight (kg)=16.47,SE= 0.80; 95% CI = (14.90-18.05); mean epidural space (cm)=1.84,SE= 0.07; 95%CI = (1.70-1.97).