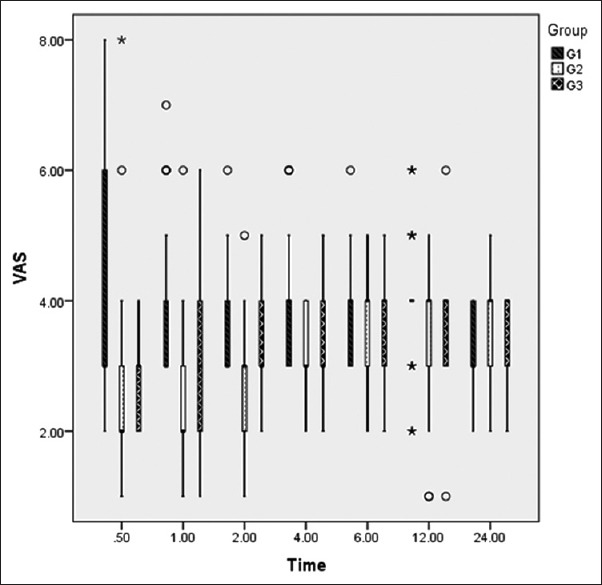
Figure 2.

Visual analogue scale (VAS) (at rest). Box Whisker plot of VAS at different time period. Boxes indicate median with 25th and 75th percentile and Whisker caps indicate 10th and 90th percentiles (° representing the outliners and *representing the extremes). Group I - Normal saline group, Group II - intravenous dexmedetomidine, Group III - intraperitoneal dexmedetomidine
