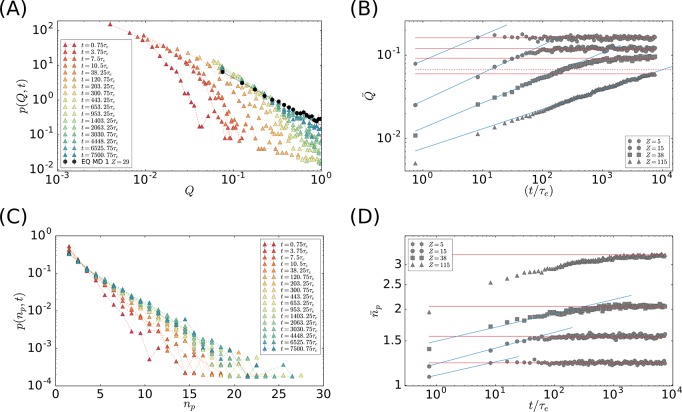
Figure 3.
Time evolution of threading statistics. (A) Time-dependent distribution functions, p(Q,t), of the relative contour length fraction, Q, of one ring threading another ring (log–log scale). Results for solutions of rings with Z = 115 prepared according to the IBP model. Similar curves are found also for other Z’s (not shown). Black circles represent the equilibrium distribution p(Q) calculated for rings with Z = 29 (Figure 1(C)). (B) Corresponding mean values, Q̅(t) (symbols), as functions of time (log–log scale) and power-law fits to the data (eq 2, blue lines) in the initial stage of the equilibration. Solid horizontal lines for Z = 5, 15, and 38 denote corresponding equilibrium values Q̅(Z). For Z = 115, the solid line is for the value measured at the end of the trajectory, and the dashed line is for the extrapolated equilibrium value. (C) Time-dependent distribution functions, p(np,t), of the number of penetrations, np (linear-log scale). Similar curves are found also for other Z’s (not shown). (D) Corresponding mean number of penetrations, n̅p(t) (symbols), as functions of time (log–log scale) and power-law fits to the data (eq 3, blue lines) in the initial stage of the equilibration. Horizontal lines are for asymptotic values n̅p(Z).

