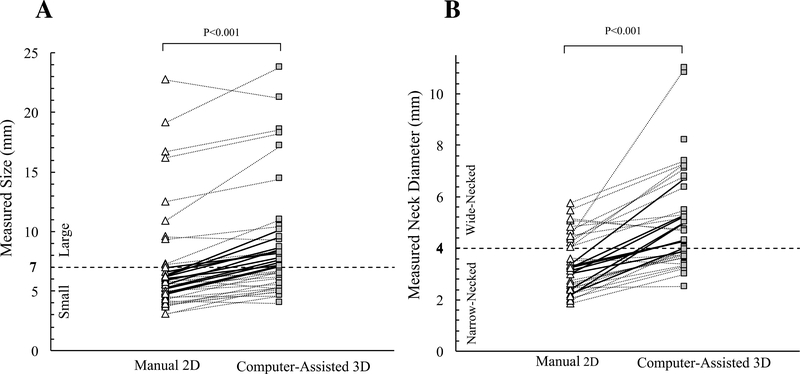
Figure 3:
Scattergrams of size (A) and neck diameter (B) measured using manual 2D and computer-assisted 3D approaches. Each data point represents the average of measurements taken by five raters. A line connects data points for the same IA. The dashed lines represent the 7mm IA size threshold for small to larger classification (A) and the 4mm IA neck diameter threshold for narrow- and wide-necked classifications (B).

