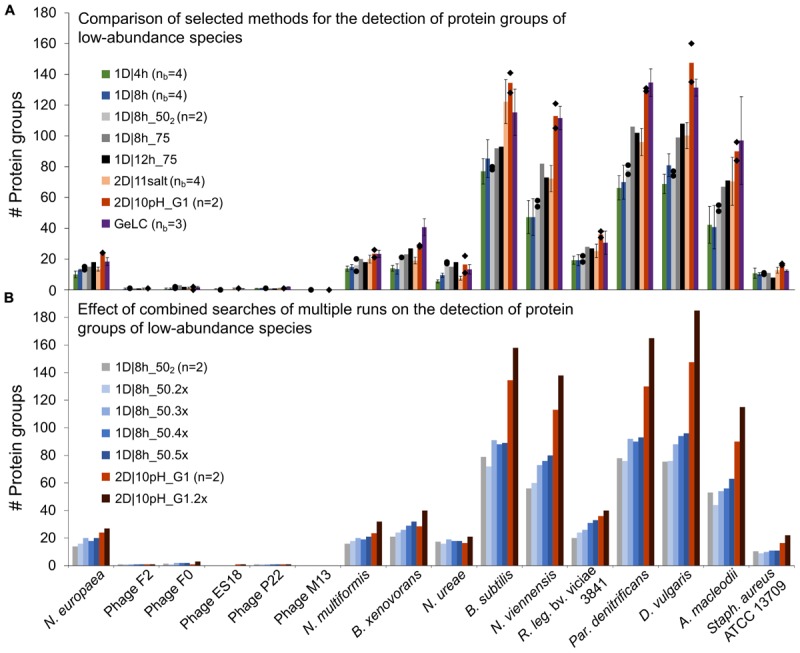
FIGURE 4.

Number of protein groups of low-abundance organisms in the mock community identified by different LC methods. (A) Comparison of selected 1D and 2D-LC methods and the GeLC method. Shown are means (bars), individual values (black diamonds) for n = 2 and standard deviations for nb = 3 and nb = 4. (B) Results for searches combining multiple runs. The number of runs combined for searches in MaxQuant is indicated by the number of runs followed by “x.” n, number of technical replicates; nb, number of biological replicates.
