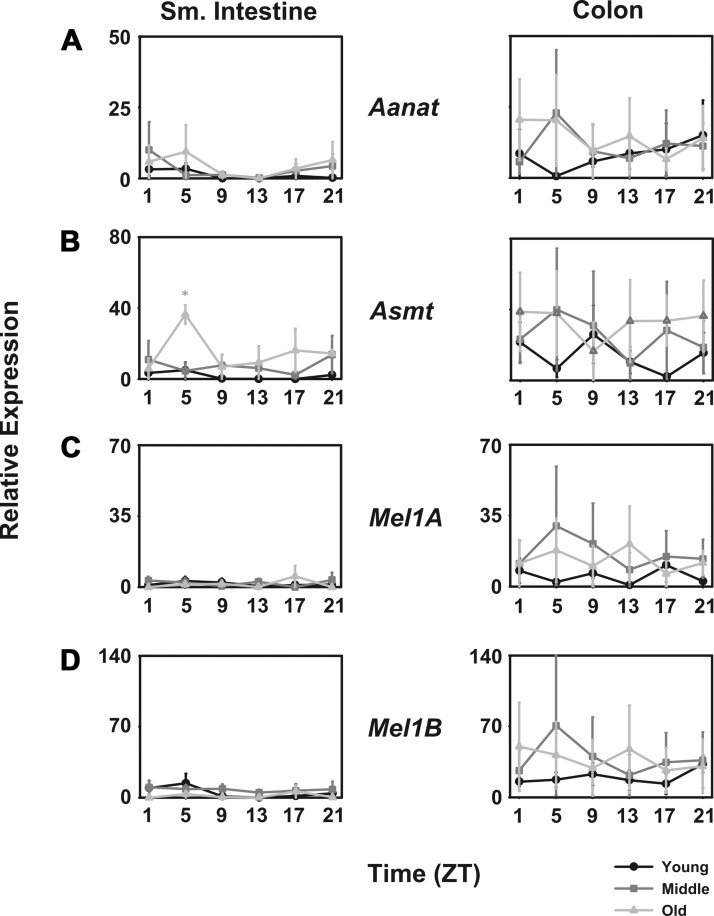
Fig. 1.
Melatonin biosynthesis and receptor transcripts are expressed in both small intestine and colon. Comparison of young (black lines with circles), middle-aged (dark gray lines with squares), and old-aged (light gray lines with triangles) mice (n = 5 per age per time point) of relative abundance in mAanat (A), mAsmt (B), mMel1a (C), and mMel1b transcripts (D). Shade-matched asterisks indicate significant difference as determined by 2-way ANOVA. x-Axes are plotted as Zeitgeber time (ZT), where ZT0 corresponds to lights on and ZT14 corresponds to lights off in a 14:10 light-dark cycle.

