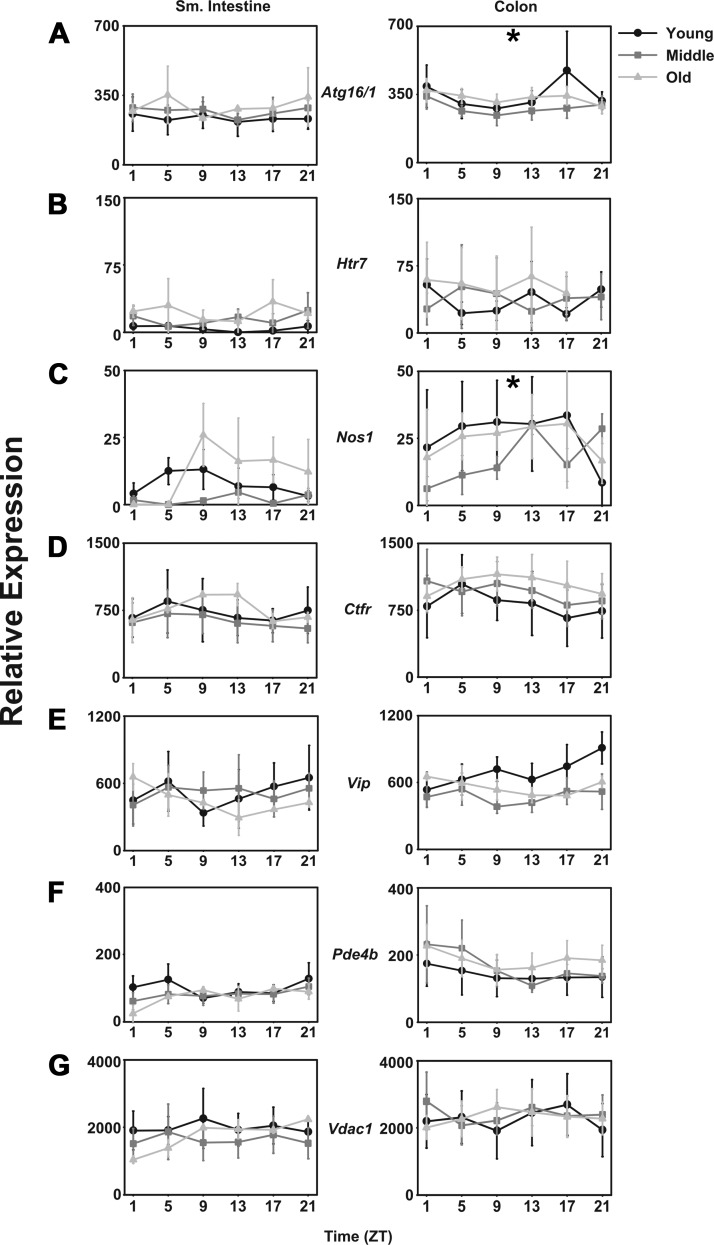
Fig. 5.
Cell signaling transcripts are not affected by aging in CBA/J mice. Relative expression levels in young (black lines with circles), middle-aged (dark gray lines with squares), and old-aged (light gray lines with triangles) mice (n = 5 per age per time point) of mAtg16/1 (A), mHtr7 (B), mNos1 (C), mCtfr (D), mVip (E), mPde4b (F), and mVdac1 (G) in small intestine and colon. Shade-matched asterisks indicate rhythmic expression as determined by Circwave software. x-Axes are as in previous figures.

