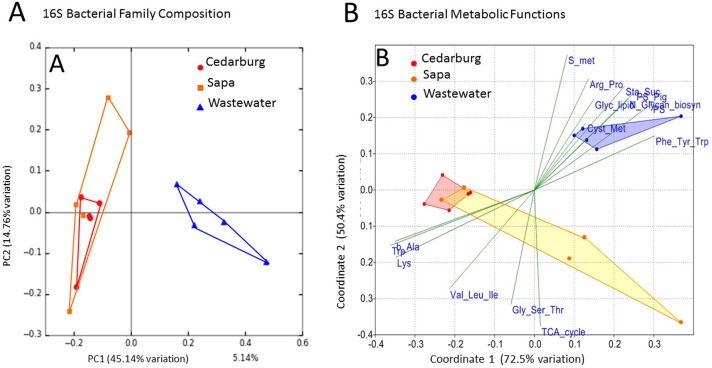
Figure 4. PCoA of pitcher plant bacterial composition and functions in two populations.
(A) Pitcher bacterial communities visualized with PCoA for pitcher bacterial composition, and (B) Non-metric multidimensional scaling plot of PICRUSt predicted bacterial metabolic functions, in five pitcher samples from each wetland, compared with five wastewater reference samples. Metabolic functions plot shows 15 selected function categories as vectors separating the communities. Convex hulls overlay the sample points for each group, showing overlap between the two wetland populations, which are distinct from the wastewater communities. Vector name abbreviations relate to metabolic processes associated with: b_Ala–b-Alanine, Lys–Lysine; Val_Leu-Ile–Valine-Leucine-Isoleucine; Trp–Tryptophan; Gly_Ser_Thr–Glycine-Serine-Threonine; TCA_cyle; S_met–Sulphur metabolism; Arg_Pro–Arginine-Proline; Glyc_lipid–glycerolipid; Sta_Suc–starch and sucrose; PS–photosynthesis; PS_Pig–photosynthetic pigments; Glycan_biosyn–glycan biosynthesis; Cyst_Met–cysteine-methionine; Phe_Tyr_Trp–Phenylalanine-Tyrosine-Tryptophan.

