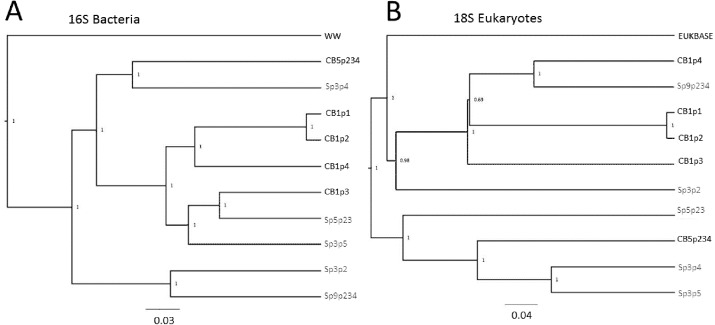
Figure 6. Relatedness trees for samples in two populations based on 16S and 18S rRNA sequences.
Genetic diversity trees of samples from Cedarburg Bog and Sapa Bog based on 16S bacterial (A) and 18S eukaryotic (B) composition of taxa identified in five pitcher fluid samples from each population. Bootstrap values for jackknife trees generated in QIIME were based on 100 iterations with a minimum of 75% of the smallest sample sequence number. Cedarburg (CB) sample branches are black while Sapa (Sp) sample branches are grey. Bacterial composition of samples is compared with pooled wastewater outgroup (WW), and a curated freshwater EUKBASE database from SILVA.

