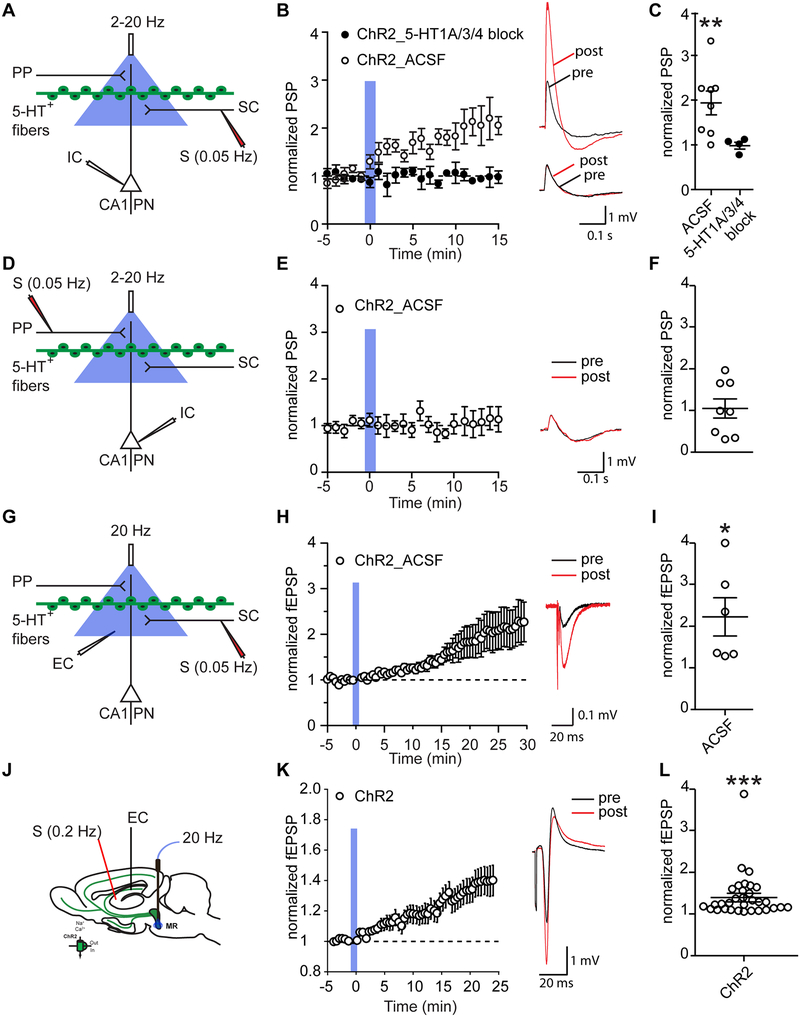
Figure 4: Optogenetic activation of serotonergic fibers in CA1 elicits a long-lasting potentiation of the CA3-CA1 synapse.
(a, d, g, k) Experimental configuration and circuit schematic. (a-c) When electrical stimulation of SR of CA1 at 0.05 Hz was paired with 50 blue light pulses (2 Hz), the PSP of CA1 pyramidal neurons increased. A cocktail of 5-HT receptor antagonists (GR113808, 100 nM; Odansetron, 10 nM; WAY100,635, 100 nM) blocked this potentiation of the CA3-CA1 synapse. (d-f) When the same protocol was applied to the perforant path we observed no potentiation. 2 Hz and 20 Hz experiments were averaged together because no effect of blue light stimulation frequency and no interaction between blue light stimulation frequency and time was detected. (g-i) When electrical stimulation of SR of CA1 at 0.05 Hz was paired with 50 blue light pulses (20 Hz), and local field potentials were recorded extracellularly (EC), the fEPSP in CA1 was increased. (k-m) When electrical stimulation of SR of CA1 at 0.2 Hz was paired with 50 blue light pulses (20 Hz), and local field potentials were recorded in vivo, the fEPSP in CA1 was increased. (b, e, h, l) Vm traces are taken from experiments representative of the population average. Pre and 10 min post optogenetic stimulation traces are overlaid. Vertical blue shading indicates optogenetic stimulation. (c, f, i, m) Scatterplots show the normalized PSP 10 – 15 minutes after optical stimulation (c, f), the normalized fEPSP 25 – 30 minutes after optical stimulation in slices (i), and the normalized fEPSP 20 – 25 minutes after optical stimulation in vivo (m). T-test based significant differences from baseline and between groups are indicated. *: p < 0.05, **: p < 0.01, ***: p < 0.001.

