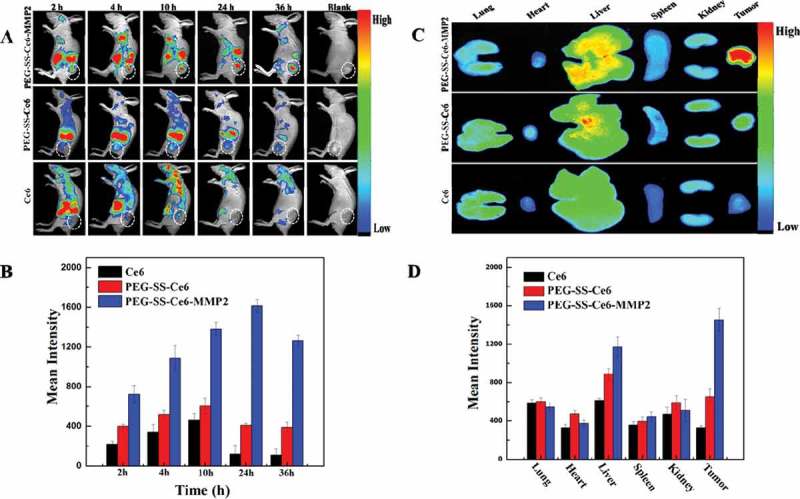
Figure 10.

In vivo biodistribution and in vitro fluorescence images of major organs and tumors. (A) In vivo time-dependent whole body fluorescence imaging of A549 tumor-bearing mice after intravenous injection of probes. (B) Quantification of average fluorescence signals in the tumor site of panel (A). (C) In vitro fluorescence images of major organs and tumors of mice after intravenous injection of probes over a period of 36 h. (D) Quantification of average fluorescence signals of panel C. Reproduced with permission from Ref. [131]. Copyright 2016 American Chemical Society.
