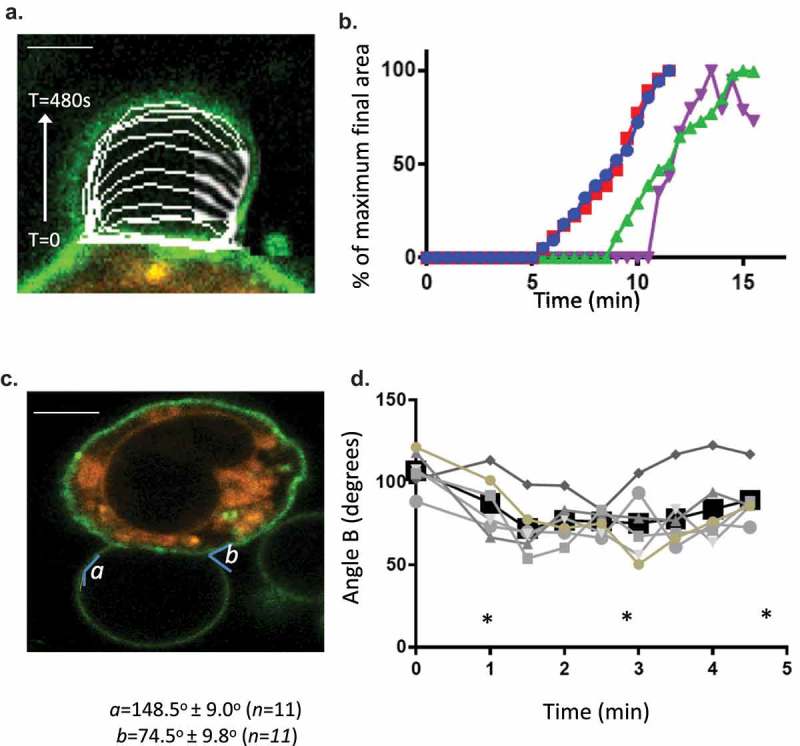
Figure 2.

Formation dynamics of LPMB. (a) Formation kinetics of a LPMB in a representative cell. Cells were stimulated via FcεRI and live-cell stained with Alexa 488-WGA. Live-cell confocal time series of an evolving LPMB were captured for a single z disc. Each white line represents the size of the LPMB at 15 s intervals. Scale bar 2 microns. (b) Example formation kinetics of LPMB from four cells. Four LPMB were measured over a 15 min period in FcεRI-stimulated and live-cell Alexa 488-WGA-stained RBL2H3. Live-cell confocal time series of an evolving LPMB was captured for a single z disc. LPMB size over time was normalized as a percentage of their final attained area. Each colour represents a different LPMB, and diversity in lag time, and similar formation kinetics and occasional deflation of the LPMB are observed. Table II. Statistical analysis of LPMB formation. (c) Formation angles of LPMB. Example LPMB from RBL2H3 stimulated for 8 min via FcεRI and live-cell stained with Alexa 488-WGA. Two angles were selected for measurement (a and b). (d) Acute formation angle b measurements over time. Measurements were taken at indicated intervals, with 0 min being the earliest visible onset of GMPV formation. Each line represents a LPMB from a different cell. Data points at the times indicated by asterisks (*) were tested for significant difference by a Student’s t test and no significant variation was found (p > 0.05).
