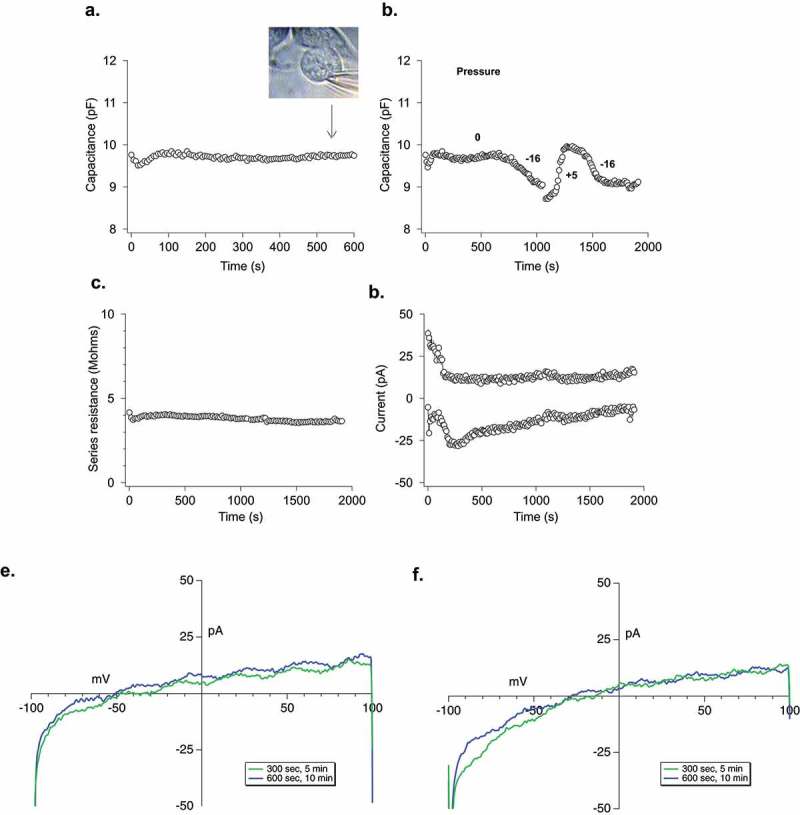
Figure 4.

Electrophysiological analysis of LPMB. (a) Cellular capacitance during LPMB formation. Capacitance recording under whole-cell patch clamp of RBL2H3 cell where stimulation was mimicked by 1.2 µM buffered calcium in the internal solution. LPMB formation started after ~80 s. Bright-field image of the LPMB showing the position of patch pipette at 540 s timepoint is shown in inset. LPMB is displayed at 540 s. The capacitance recording was taken every 2 s for the duration of the recording. (b) Effect of mimicking altered hydrostatic pressure on membrane capacitance. An extended recording of capacitance in the RBL2H3 cell that showed LPMB formation. Positive and negative pressure was applied to the pipette to shrink and expand the cell with internal pressure, showing that while LPMB formation did not cause a change in capacitance, this change could be elicited form the same cell artificially. The capacitance recording was taken every 2 s for the duration of the recording. (c) Series resistance during LPMB formation. Series resistance recording spanning 2000 s, taken every 2 s of an RBL2H3 cell that showed LPMB formation. The series resistance recording was performed on the same RBL2H3 cell that was used in Figure 4(a). (d) Absence of inward and outward currents throughout the LPMB formation period. Current recording in pA spanning 2000 s of an RBL-2H3 cell that showed LPMB formation. The current was generated with a ramp pulse from −100 mV to +100 mV with the current extract at −80 mV and + 80 mV. The ramp was pulsed every 2 s for the 2000 s duration. (e) Representative current voltage relationship displayed at 300 s and 600 s into recording during LPMB formation. Each of the graphs represents a single cell with two traces (green and blue which represents 300 s and 600 s, respectively) extracted and displayed to show the current voltage relationship of the cell during LPMB formation.
