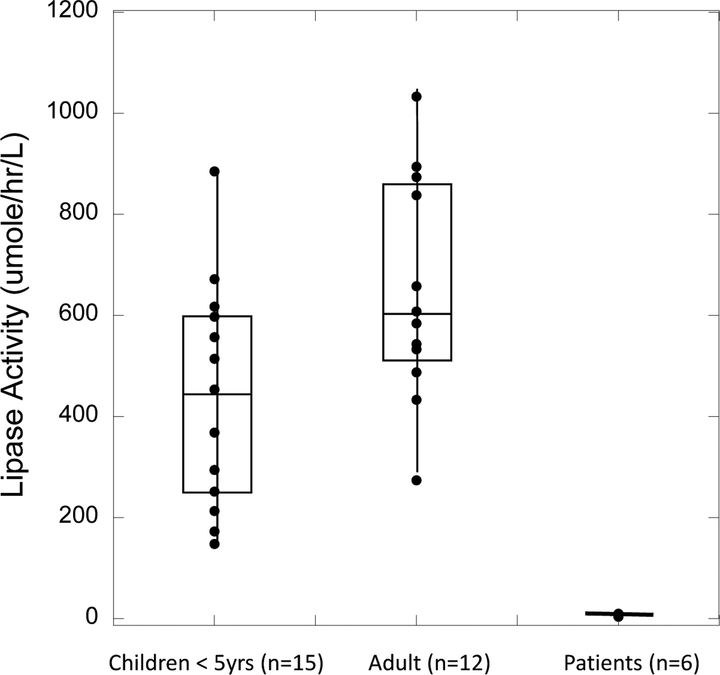
Figure 3.
LAL activity in DBS measured with substrate P-PMHC and UPLC-MS/MS. The bottom of each box is the value of the first quartile, the middle line is the medium value, and the top line is the third quartile. All values are blank corrected. Individual patient values are given in Supplemental Table 4.

