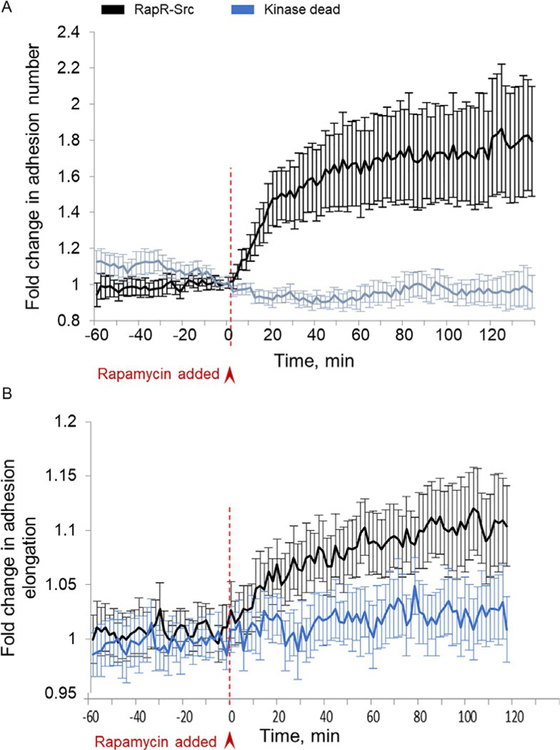
Fig. 2.
(A) Time-lapse quantification of focal adhesion numbers using metamorph and MATLAB softwares. Focal adhesion number at any time point was normalized to the average number of focal adhesions before c-Src activation. (B) Focal adhesion elongation was measured using the focal adhesion analysis server. Error bars represent 90% confidence intervals (n = 22 cells for RapR-Src; n= 15 cells for kinase dead) (Karginov et al., 2014).

