Fig. 2.
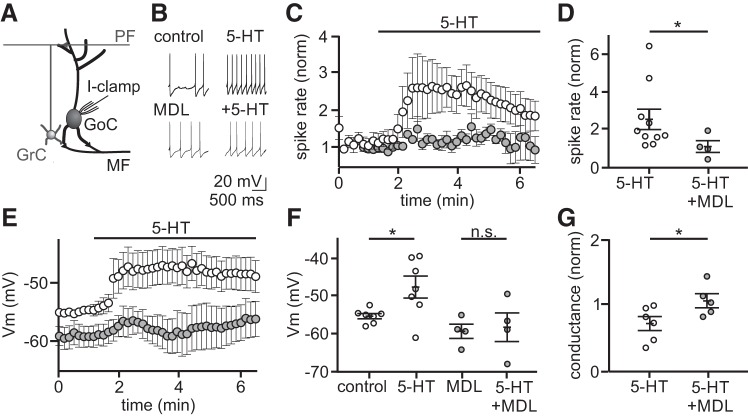
5-Hydroxytryptamine (5-HT) depolarizes Golgi cells by activating 5-HT2A receptors. A: schematic of the recording configuration. B: example traces from two individual whole cell, current-clamp recordings from Golgi cells before and during bath application of 5-HT (10 μM), with and without the 5-HT2A receptor-specific antagonist MDL 100907 (500 nM). NBQX (5 μM), R-CPP (5 μM), and SR95531 (5 μM) present in all recordings. C: summary of normalized spike rates across time in control (open circles, n = 10 Golgi cells treated with 5-HT, no MDL present) and in MDL (gray circles, n = 4 Golgi cells treated with 5-HT, MDL present). D: summary of mean normalized spike rates during peak 5-HT response window in control and in MDL. E: summary of membrane potential (Vm) over time with 5-HT added to control (open circles, n = 7) and MDL (gray circles, n = 4). F: summary of mean Vmvalues during control, 5-HT, MDL, and MDL + 5-HT. Vm values in 5-HT were measured at the time of peak 5-HT modulation, and all experiments were performed in TTX (1 μM). n.s., statistically nonsignificant. G: summary of normalized change in conductance during 5-HT application in control (open, n = 6) and MDL (gray, n = 5) as measured by a 5 mV test pulse. *P < 0.05.

